

The Bookmarks view
The Bookmarks view is the library of every bookmark on every page: a rail of filters, a list and a side panel. It is also where health, uptime and drift are watched.
The Bookmarks view is the library: every bookmark on every page, in one workbench with a rail of filters, a list and a side panel. It replaced Config → Bookmarks → List, and it is where availability checking, uptime and drift are watched.
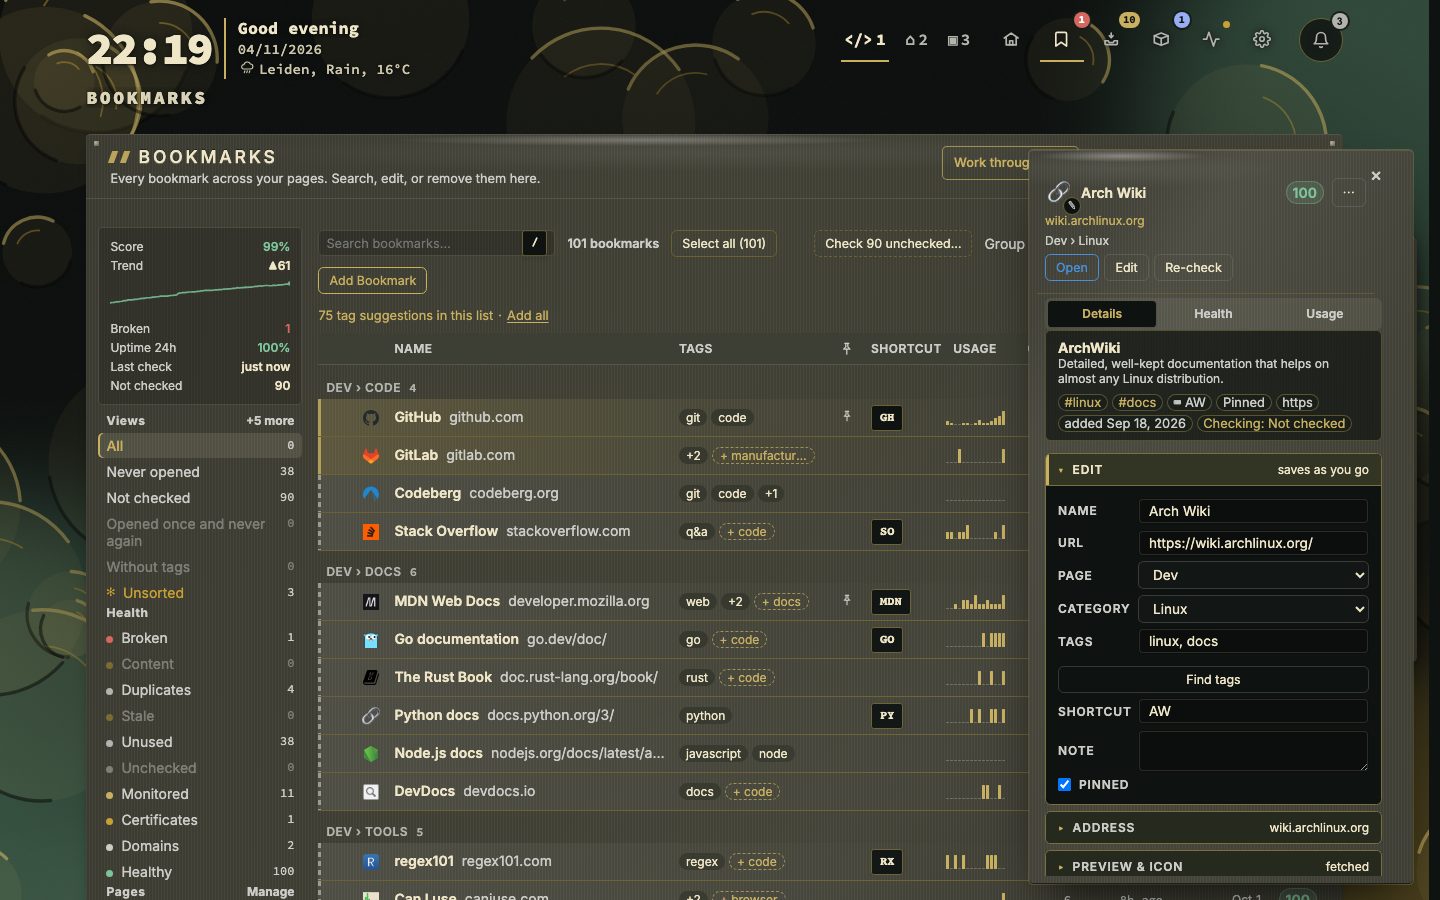
Open it with Shift + H or the Bookmarks icon (the whole list), Shift + U (on Unsorted), :health (on the broken ones), or /#bookmarks. Old /#health and /#health/monitors addresses, and :health, still land here, on the matching filter; a search that came with them (hv_q) comes along, and hv_refresh still re-scans on arrival. See Addresses for the current address scheme.
The rail
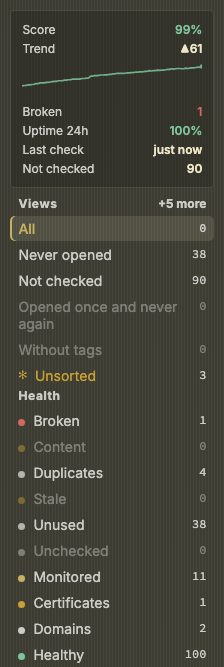
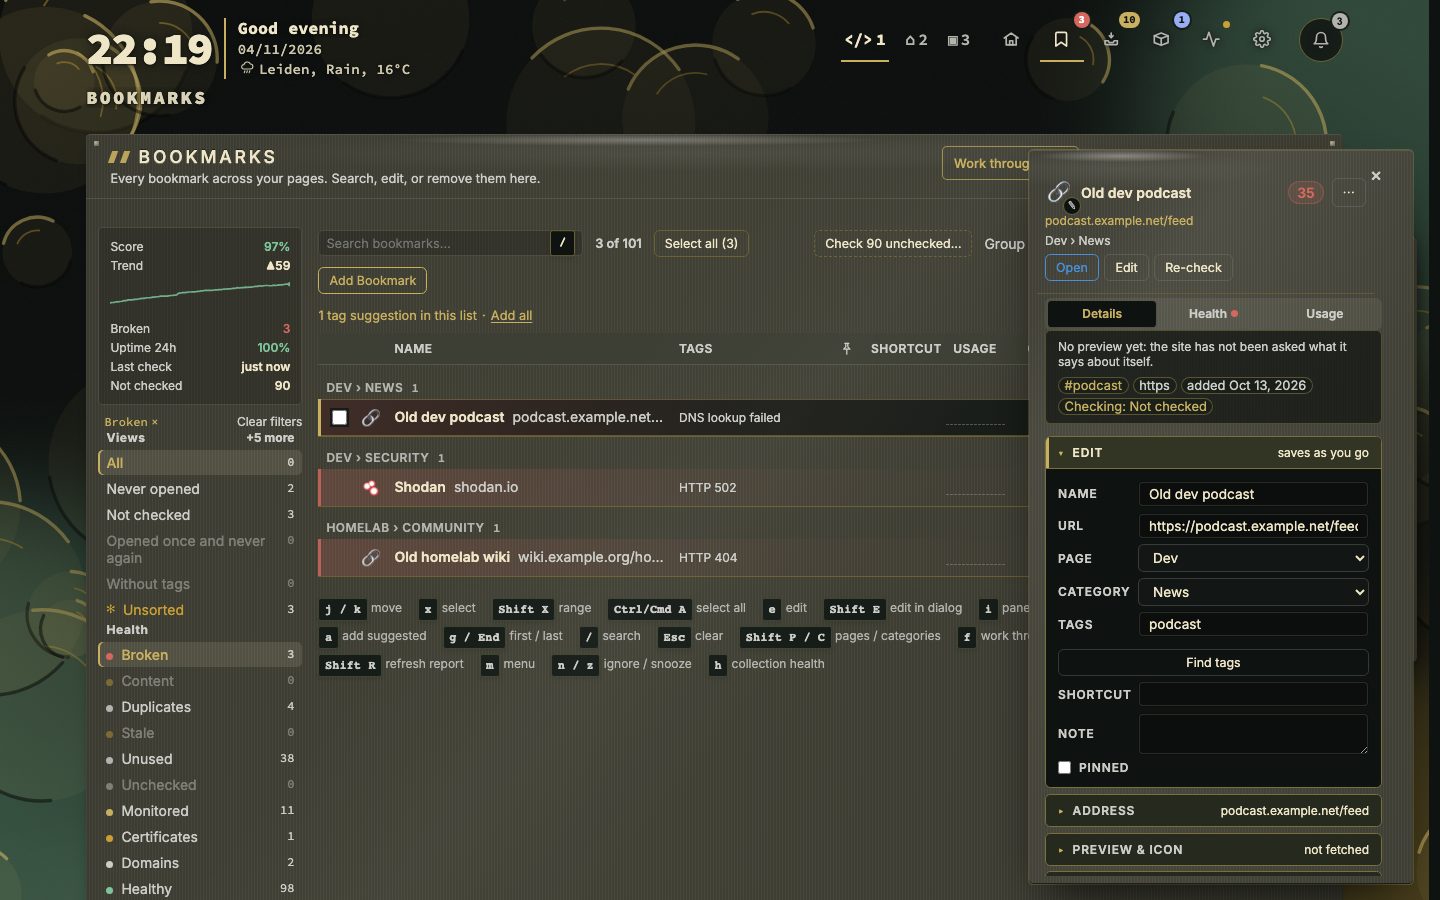
A summary at the top shows the score, the trend, the broken count and uptime over 24 hours — the same readouts the old health view carried, plus how many bookmarks nothing checks at all. Below it, filter groups (each block can be switched off under Config → Bookmarks → View → Rail):
| Group | Shows |
|---|---|
| Views | All, and questions about the filed library: never opened, not checked, opened once, untagged, not on HTTPS, no icon, duplicates, changed recently — plus Unsorted (✻), always shown, which swaps the pool for links kept from the inbox with no page yet |
| Health | Broken, Content, Duplicates, Stale, Unused, Unchecked, Monitored, Certificates, Healthy |
| Pages | Every page, with a Manage link to the pages & categories modal |
| Categories | Every category, narrowed to the selected page once one is picked |
| Tags | Every tag in use, with an all link once there are more than a dozen |
Active filters show as removable tokens above the groups, with Clear filters to drop them all at once.
The toolbar and the list
The toolbar sits above the list: a search field (/) that matches name, URL, category, note, shortcut and tags; a count of what is shown; Group (No groups, Page, Category, Site, Status, Tag); Sort (Page order, Name A–Z, URL, Category, Recently added, Last opened, Most opened, Pinned first, Tags, Shortcut, Usage, Health score); and Add bookmark, which opens the full form on the page the list is filtered to.

Rows show icon, name, host, tags, open count and last opened, plus a score column and status glow once Health has joined in. Only the rows near the screen are drawn, so thousands of bookmarks stay fast.
A bookmark that is a container's web UI carries a small cube after its title, in the container's state: green running, amber paused or restarting, grey stopped. A click opens that container in the Containers view (Containers › The list). The match is the Containers view's own, and the cubes stay away when the Docker socket is not set up or the Containers view is switched off.
Column headings name the columns View shows and stay in place while the list scrolls (not at phone width). Every heading with a value under it sorts: a click sorts by that column in its natural order — Name and Tags A to Z (by the first tag, untagged last), Shortcut the keyed ones first, Usage the most opens in the sparkline's window first, Opens, Last opened and Added highest or newest first, Pinned the pinned ones first, Score the worst first — and a second click turns it round. An arrow on the heading shows which way the list runs; Sort follows, and picking from Sort starts afresh in the natural order. Enter or Space on a focused heading does the same.
The side panel
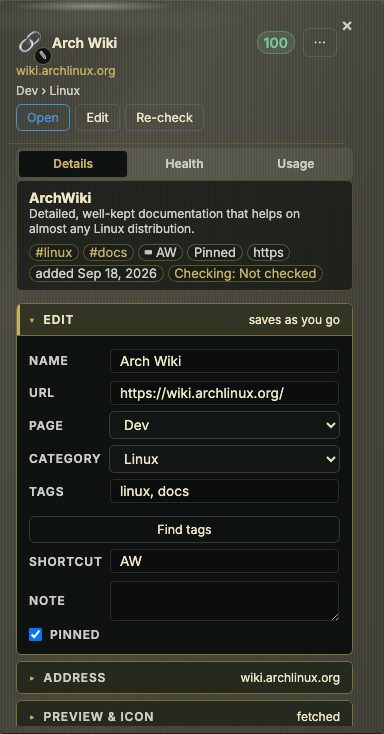
Focusing a row opens the side panel: Details, Health and Usage, switched with 1/2/3 or [/], or i to open or close the panel itself.
- Details edits the bookmark in place — name, URL, page, category, tags (with autocomplete and suggestions), shortcut, note, pin, availability checking and interval. Lists and checkboxes save on change, text fields when you leave them;
Escapeputs the old value back. It also offers Open and Edit in dialog (Shift + E). An Unsorted bookmark shows a primary Promote button here instead of a page and category (Unsorted and Promote). - Health shows the availability mode and interval, Expected response (Checks & health › Expected response), and the reasons a bookmark is flagged, each with the score it costs.
- Usage shows opens, last opened and the same activity the dashboard counts.
The panel's head carries two menus:
- ✎ on the icon — Choose app icon…, Use letter and Automatic, the same three a container has, with the one in force ticked. Automatic is no icon of the bookmark's own: the app's icon where the icon sets know the address, else the favicon. Use letter keeps the letter tile on the dashboard and stops nextDash fetching an icon for it — the background fill and Refresh all favicons pass it by. Choosing or uploading an icon later ends it (Data, backups and import › Icons & previews).
- ⋯ beside the score — the rest, under headings: Checks (detect redirect, reporting, snooze 30 days, merge a duplicate group — while the bookmark has a finding), Refresh (title, favicon), Copies (open the archived copy, save a local one), Elsewhere (share link, show on dashboard), and Delete at the foot.
Closed with the mouse — × or a click beside it — the row lets go as well, so the arrow keys and Space scroll the page again; closed with Esc or i, the row stays the cursor for the keys. Details → Address also offers Open in new tab, Copy URL, Share and QR code (Shift + J on the dashboard opens the same). A bookmark that is a container's web UI says so under Details → Address → Runs in, with a link to that container (Containers › The list).
On a narrow window the rail becomes a drawer and the side panel a sheet. What you filtered to is kept in the address, so a filtered list is a link.
Selecting several
Tick rows (x ticks the row under the cursor, Shift + X a range from the last one you ticked; Ctrl/Cmd + A or the Select all button in the toolbar ticks every bookmark the filter and search show, drawn or not, and a second press clears them again) and the selection bar appears above the list — ticking does not open the side panel, as in Inbox and Containers. The bar counts what is ticked and offers Edit…, Re-check, Mute alerts, Export CSV, Delete and Clear selection. Edit… opens the form for the selection in the side panel (one ticked row opens its own panel): page, category, tags (add, replace, remove), pin all / unpin all, checking and interval, Mute alerts / Unmute, Re-check, Follow redirects, Accept drift, Rebuild previews, Refresh favicons, Save a copy on this disk, Export CSV, and Delete. Fields that differ read mixed. The slow ones run one page at a time behind a progress bar, wait out a rate limit, and can be stopped. A selection survives a filter change; bulk changes and moves can be undone from the toast.
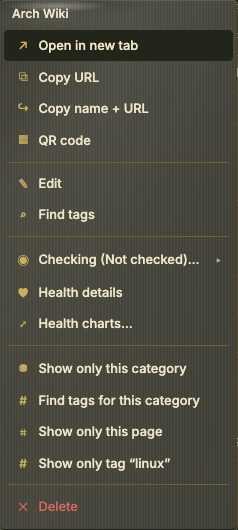
The row menu
The row menu (right-click, Shift + F10, or m) offers open, copy URL, share, Promote… (only on an Unsorted bookmark), edit, checking, health details, Health charts… (the bookmark's health in large, A bookmark's health in large), Merge… on a duplicate, filters (only this category, page or tag), and delete.
Keys
| Key | Action |
|---|---|
j / k, arrows | Move |
g / End | First / last row |
Enter / o | Open the bookmark under the cursor |
i | Open or close the side panel |
1 / 2 / 3, [ / ] | Details, Health or Usage in the side panel |
e / Shift + E | Edit in the side panel / in the full dialog |
x / Shift + X | Select a row / a range |
Ctrl/Cmd + A | Select every bookmark shown (again to clear) |
d | Delete (undo is offered) |
/ | Search the list |
f | Work through the list |
h | Collection health |
Shift + H (on a row) | That bookmark's health in large |
p | Re-check |
s / c | Score / checking, in the Health tab |
n / z | Ignore / snooze what the report says |
m | The row menu |
Shift + R | Refresh the health report |
Shift + P / Shift + C | Pages and categories over the list |
Esc | Clear the selection, close the panel, then leave the view |
Work through and the header band
Above the list, Work through (f) takes you through the bookmarks that need a decision, one at a time.

1. Choose a pile. It opens on a list of piles, each with its count and a line on what it holds. The pile that needs you most comes first:
| Pile | Holds |
|---|---|
| Broken links | Down, refused or not found — fix the address or let them go |
| Changed or wrong content | Moved, retitled, or no longer the page you saved |
| Stale | Not opened within count as neglected after — still worth keeping? |
| Never opened | Saved and never used |
| This list, as it is filtered now | Every bookmark the list shows, in its order — always last |
↑/↓ choose, Enter starts, Esc leaves. Empty piles are left out.
2. One bookmark at a time. The card shows the pile and your place in it (Broken links · 3 of 12), the bookmark with its page and category, when it was last opened, its preview, and Why it is here: the reasons from the health report. The main button follows from the reason:
| Key | Action | What it does |
|---|---|---|
p | Re-check now | Main button for broken and changed links. Checks it again; when the problem is gone it counts as fixed and leaves the pile |
o | Open it and decide | Main button for stale and never-opened links. Opens it in a new tab; also the Open button and the title |
e | Fix the address | Opens the bookmark form over the card. A save checks the new address, so a link that answers there leaves the pile |
d | Delete | Asks first, then moves it to the trash |
y | Keep | Fine as it is: this reason will not come up again for this bookmark. Undo it from the side panel's Health tab |
z | Ignore 30d | Silences the reason for 30 days, as the row menu's z does |
j / k | Skip / back | Next or previous card, without a decision |
Esc | Leaves; the list stays as it was |
Re-check stays in the row beside the main button when that button is Open. Keep and Ignore appear only when there is a reason to silence.
3. The end of a pile. Work through counts what the run did — fixed, deleted, kept, snoozed — and offers the next pile that still has bookmarks (Start: …), or Back to the list.
Ten links, two minutes. When five or more bookmarks need a decision, a row in the notifications bell says 10 links to review and names what is waiting — for instance how many are broken or never opened. Start runs a session over the worst ten in this same view. It ends with a count of what you dealt with — skipping is not handling — and offers Another ten while more are waiting. Done for today puts the offer away until tomorrow; No on the row puts it away until more links need a decision. Neither touches any bookmark. Offer to review links under Behavior → Privacy & sync → Onboarding switches the offer off; link checking itself stays on.
When the row has a preview nextDash could fetch but the bookmark does not store, its reason reads "Preview fetched, not saved yet" and a Save preview button (s) writes it onto the bookmark.
Beside it, the Collection ▾ menu gathers what a whole-collection toolbar used to hold, in groups:
- Look at — Collection health (
h, Collection health) and Rot report. - Organise — Pages & categories (
Shift + P), Merge duplicate group… when exactly one group exists, Turn on checking… for everything still Off. - Checks — Retest all, Open broken links…, Fetch previews…, Checking off….
- Export CSV, Refresh report (
Shift + R), and Health settings.
The menu opens with its first item focused; ↑/↓, Home and End move through it. When the duplicate groups have shrunk to one bookmark each, Merge duplicate group… says No duplicates left to merge.
An ⓘ beside the menu explains the view, and Tour next to it plays a five-step walkthrough of it (Config).
Collection health
h, or Collection health in the menu, opens a modal over the list with three tabs:
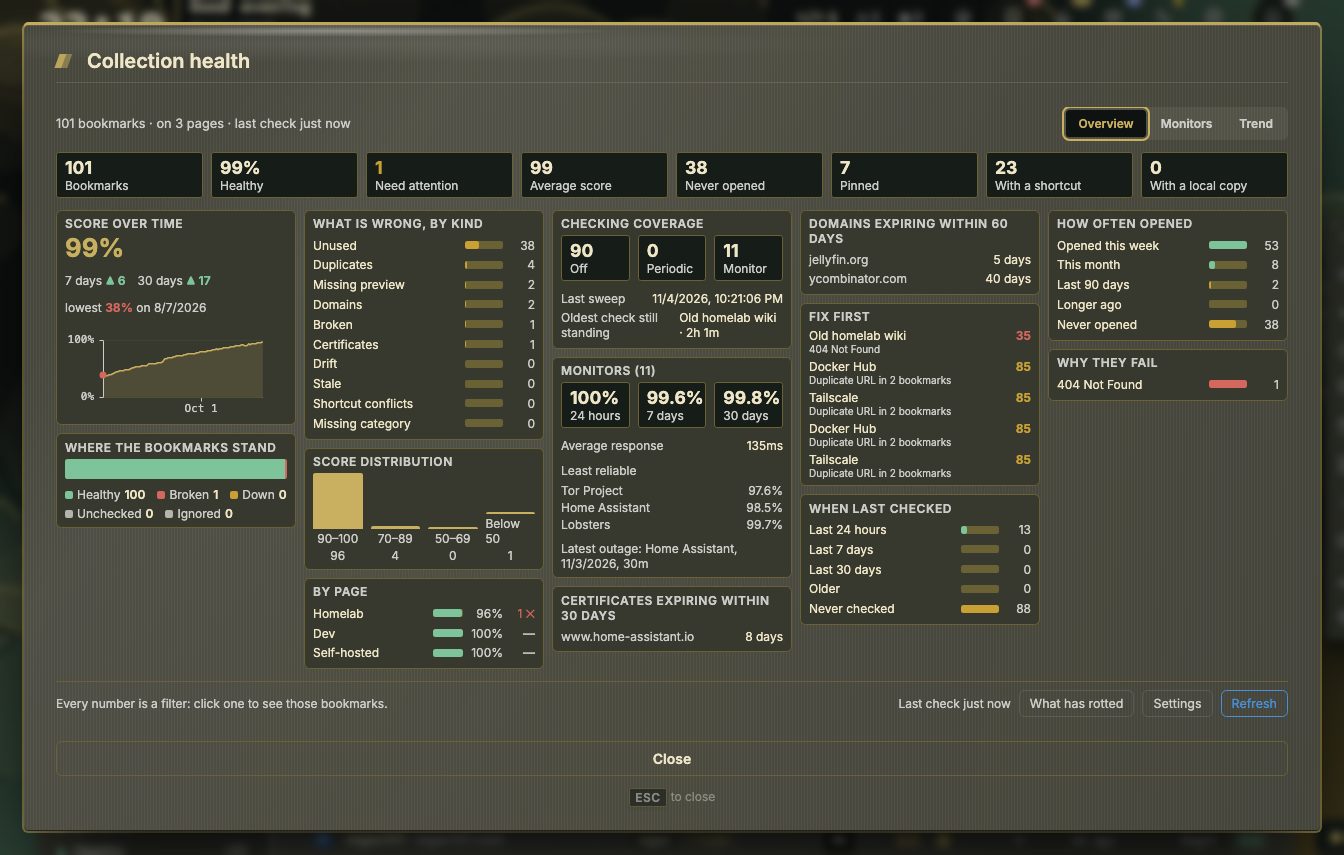
- Overview — a row of key figures (bookmarks, healthy, need attention, average score, never opened, pinned, with a shortcut, with a local copy), the score over time, where bookmarks stand, what is wrong by kind, the score distribution, health by page, checking coverage, monitors and certificates. Cards add Fix first (the lowest-scoring bookmarks and why), When last checked, How often opened and Why they fail (the broken ones, by error).
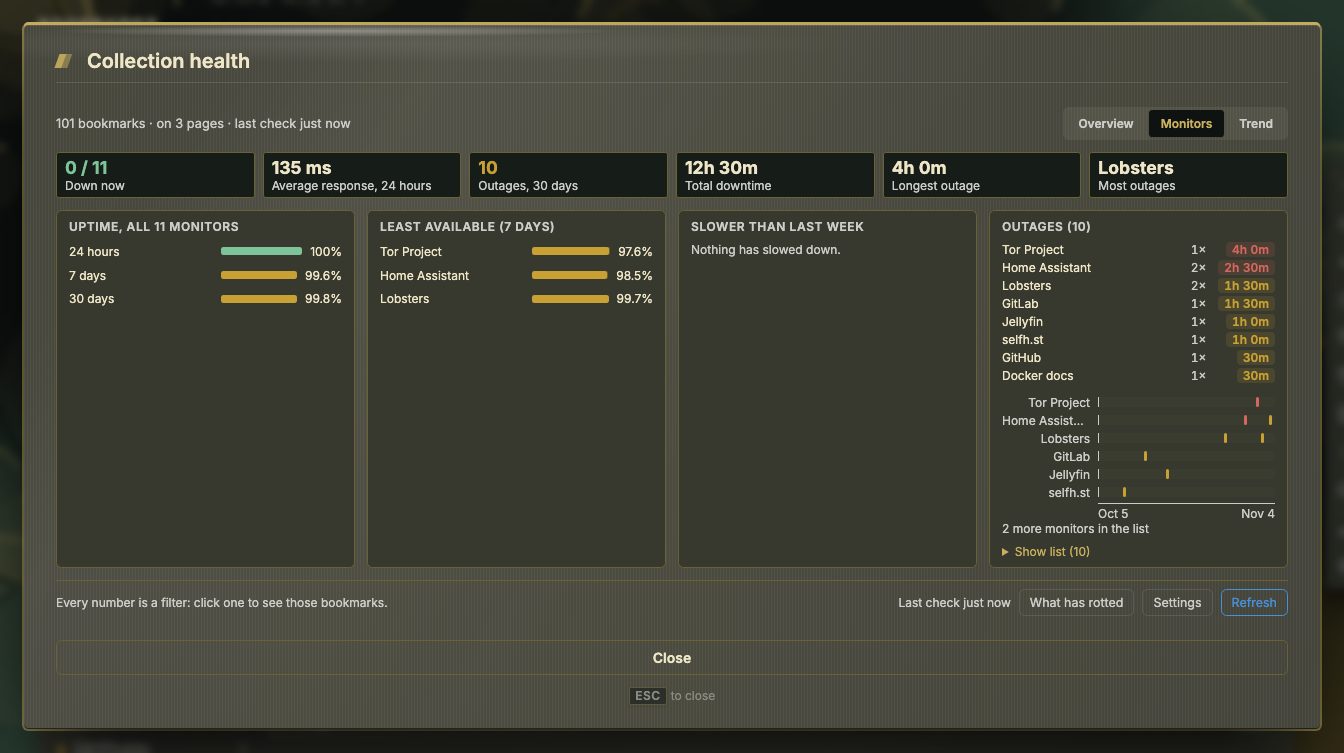
- Monitors — a row of figures (down now, average response over 24 hours, outages and total downtime over 30 days, the longest outage, the monitor with the most outages), then fleet cards: uptime across all monitors, the least available over 7 days, what got slower than last week, and outages — which monitors went down, how often and for how long, drawn as a 30-day lane per monitor (the full list behind Show list).
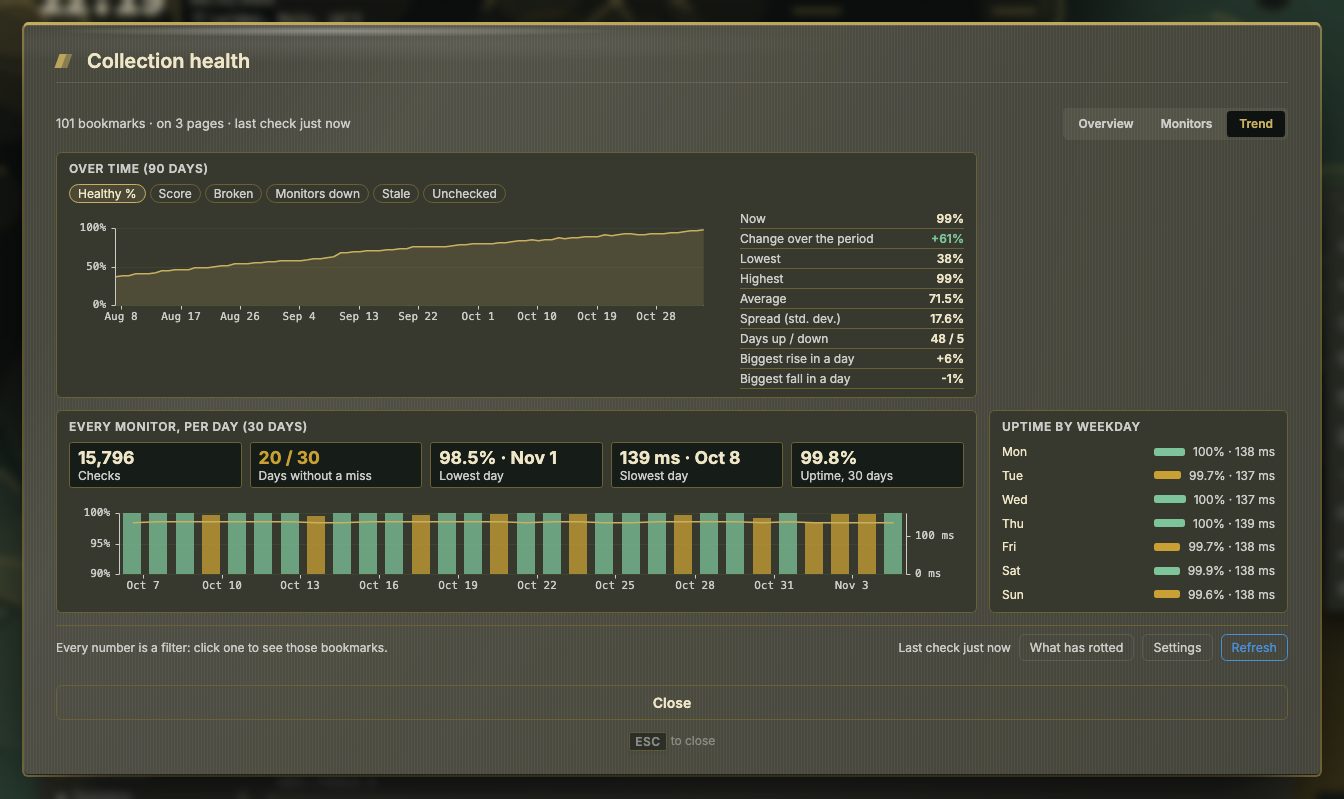
- Trend — a trend chart over 90 days with series pills (healthy %, score, broken, monitors down, stale, unchecked) and its figures beside it: now, change over the period, lowest, highest, average, spread, days up and down, the biggest rise and fall in a day. Under it, Every monitor, per day: a bar a day for the uptime of all monitors together and the day's mean response as a line, with its own figures (checks, days without a miss, lowest and slowest day, uptime over 30 days), and Uptime by weekday.
The charts here, in Statistics and in a bookmark's health in large have a time axis and a value axis, a tooltip, a drag to zoom, and the arrow keys with the point read out under the chart (Shift steps ten readings); a screen reader gets each chart as a table. On a focused chart, + and - zoom in and out around the reading and 0 shows the whole range.
It fits one screen, and steps its cards down on a small window.
📷 Screenshot — Collection health, Overview tab
📷 Screenshot — Collection health, Monitors tab
📷 Screenshot — Collection health, Trend tab
📷 Screenshot — the Bookmarks view filtered on Broken, full page
A bookmark's health in large
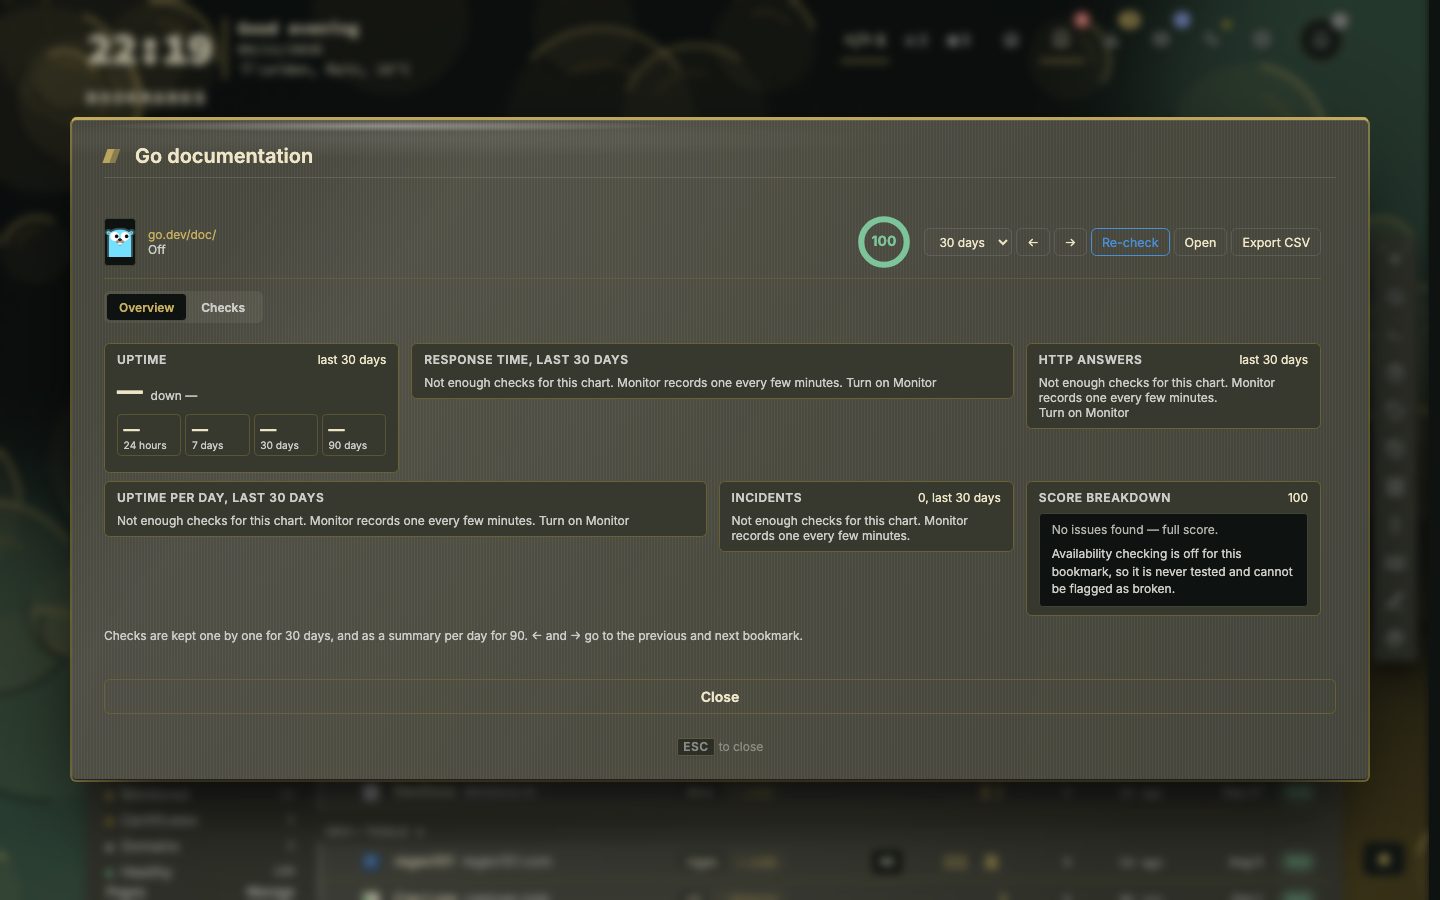
Shift + H on a row, or Health charts… from the row menu, opens that bookmark's own health in large, with two tabs:
- Overview — uptime, response time, days, status codes, outages and the score.
- Checks — checks by hour as a heatmap, the certificate, Kept copies (how long checks are retained), checks in the last 24 hours, and Every check: every check in the period with a search, Only failures, and Export CSV.
A period select (today, 7, 14, 30 or 90 days) applies across the panel.
📷 Screenshot — one bookmark's health in large, Overview tab
Rot report
Rot report, under the Collection menu, lists what has gone, what has moved or been rewritten, what has failed for over a month, what is broken and never opened, and what broke this week.
Unsorted and Promote
Unsorted holds bookmarks kept from the inbox with no page yet (Inbox › Keeping a link: Unsorted and Promote). They stay off the dashboard, the tag cloud, smart collections and the health summary, but the Views block in the rail always shows the Unsorted count, and search reaches them while Search unsorted bookmarks is on.
- Opening the Unsorted view swaps the pool: the filters, the search box and the bulk actions work on it exactly as they do on the filed library.
- An Unsorted bookmark's side panel shows a primary Promote button in place of a page and category; the row menu has the same entry. Both open the bookmark form, titled Promote bookmark, on the last page of the dashboard — pick a page and category and Save files it there.
- The Unsorted widget (Widgets › The kinds) also opens the Bookmarks view on Unsorted, with that bookmark's side panel already open.
Pages & categories modal
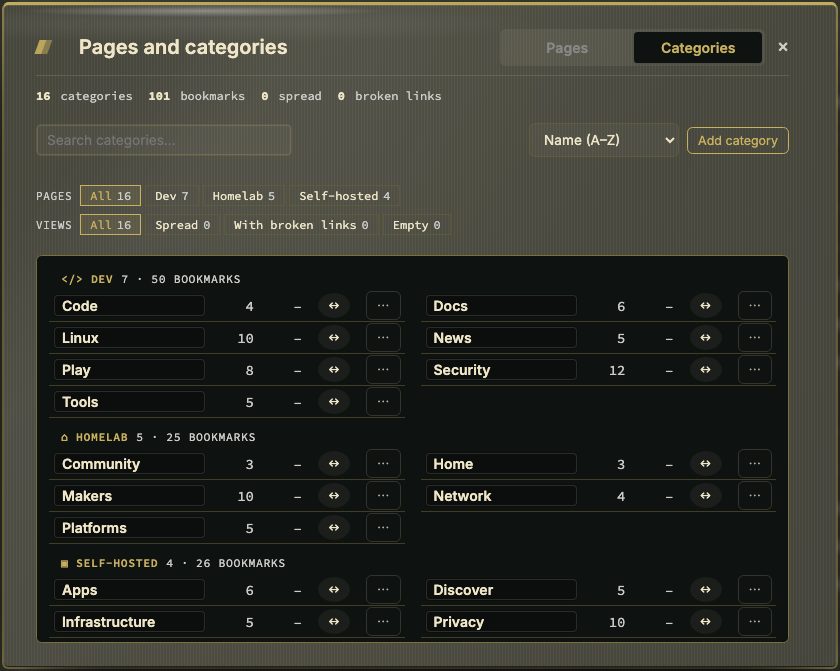
Shift + P / Shift + C, Manage beside Pages or Categories in the rail, or Pages & categories in the Collection menu opens a modal over the list for dragging, moving, merging and tidying pages and categories without leaving the Bookmarks view.
Addresses
#bookmarks[/<page>]?q=&cat=&filter=&health=&tag=&sort=&rev=&group=
#unsorted
#health                      → redirects here, on Broken
health= takes one of the Health filter keys (broken, content, duplicate, stale, unused, unchecked, monitored, certificates, healthy, and a few more reachable only from Collection health, such as drift); q= is a search term; rev=1 turns the sort round. Shift + U and the address #unsorted open the view on Unsorted directly.