

Checks & health
Set a bookmark to Off, Periodic or Monitor and nextDash checks it for you. Expected response and drift catch pages that answer but are wrong, and alerts and maintenance windows decide who hears about it.
How a monitored bookmark works, in short:
During a maintenance window (Maintenance windows) nothing is sent. A page that still answers but changed what it says is flagged as drift (Drift).
Availability modes
Every bookmark has one of three modes:
| Mode | What happens |
|---|---|
| Off | Never checked |
| Periodic | Checked now and then; flagged when broken |
| Monitor | Checked by the server on its own interval (5 minutes to 24 hours, default 15 minutes), with 30 days of history, uptime, outages and alerts. Includes everything Periodic does. |
Set the mode in the bookmark form, the Bookmarks view's side panel, the right-click menu, with Shift + C, or with c in the Bookmarks view. On a monitored row the menu also shows the check interval: 5m, 15m, 30m, 1h, 6h or 24h.
Nothing checked at all? In the Bookmarks view, pick Unchecked under Health in the rail, tick every row with X, and set the checking to Periodic under Edit… (The Bookmarks view › Selecting several).
Config → Monitoring holds the rest, on three tabs:
| Tab | Group | Settings |
|---|---|---|
| Checks | Checks in this browser | How often, skip fast pings, Retries before offline (1–10) and Delay between retries (ms) (100–3000, 450 by default; it only applies while retries are still running) |
| Checks on the server | Re-check in the background (on by default) and how often, the check timeout (5–30 s), spot pages that answer 200 but say "not found", Serve uptime badges and when certificate warnings start | |
| Monitored bookmarks on the dashboard | How much they stand out: only when there is a problem (default), always, or never | |
| Notifications | Downtime alerts and Browser notifications | See Alerts |
| Reminders | See Checks & health | |
| Weekly digest | See Checks & health | |
| Schedules | Maintenance windows and Quiet hours | See Maintenance windows |
An old check. The age shown in the Bookmarks view's summary (Last check) is the time of the newest real check, not of the last time the page was drawn. When it is a week old and re-checking in the background is off, a corner card offers to re-check now or every day (The dashboard).
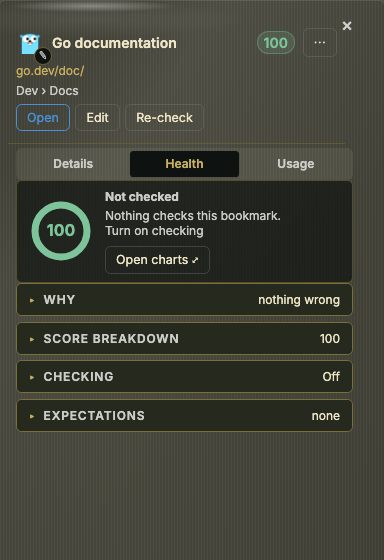
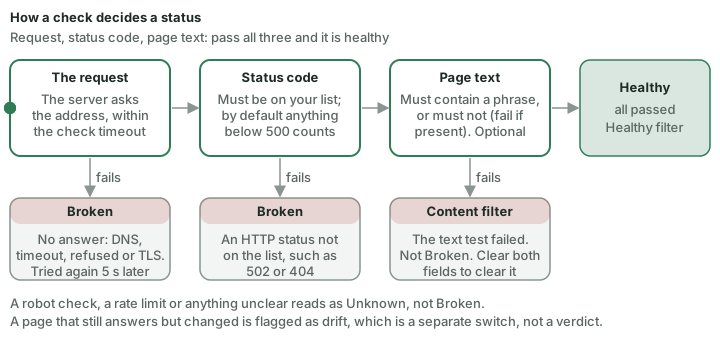
What a check records. A failure stores its cause — DNS, timeout, refused, TLS, redirect, content or an HTTP status. A failed check is tried again five seconds later and only counts if that fails too. A page that asks are you a robot, a rate limit or anything else unclear reads as unknown, not broken. Certificates are read from every HTTPS check.
How long it has been failing. The first failure of a run is kept, and the next check that passes clears it. A failing row says failing for 3 weeks, and hovering shows the day it first failed; a monitored bookmark says how long it has been down instead. When the site only refused our checks (a 403, a bot check), the row says not answering us for… rather than calling the page dead. The side panel's Health tab (Broken · 3w), the link preview card, the Rot report (The Bookmarks view › Rot report) and the Statistics figure longest-standing break (Statistics) draw on the same date.
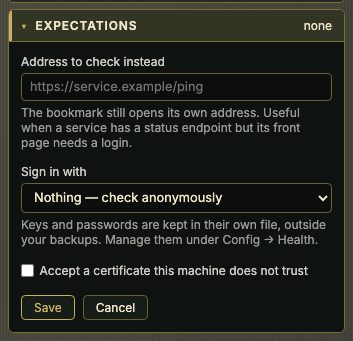
Services behind a sign-in. On a bookmark's Health tab, Expected response offers:
- Address to check instead — for example a status endpoint, while the bookmark keeps its own address.
- Sign in with — a stored sign-in. Sign-ins are created in a Custom widget's settings and kept in their own file, outside backups unless you include stored tokens. A sign-in is never sent when a check is redirected to another host.
- Accept a certificate this machine does not trust.
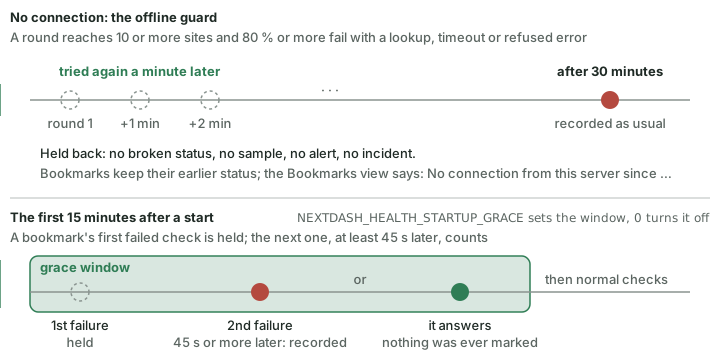
When this server has no connection. If a round of checks reaches at least ten different sites and nearly all of them fail with a lookup, timeout or refused-connection error at once, the problem is the server's own connection, not ten dead sites: it happens when nextDash starts before the machine is online. nextDash then holds those failures back: nothing is marked broken, no sample is added, no alert or incident is opened, every bookmark keeps its earlier status, and the Bookmarks view says No connection from this server since …. The round is tried again a minute later. Addresses on your own network (IP addresses, .lan, .local, single-label names) are never held back, and anything that answers is recorded as usual. If the outage lasts more than half an hour, failures are recorded normally.
The first 15 minutes after a start. When nextDash has just started, your own services may not be up yet. During the first 15 minutes a bookmark's first failed check, whatever the address, is not recorded: it gets no broken status, sample, alert or incident, and keeps its earlier status. If the same bookmark fails again at least 45 seconds later it is recorded; if it answers, nothing was ever marked. Only unattended checks wait (the monitors, the scheduled recheck and the checks the dashboard asks for); Retest all records at once. A service that is really dead is recorded a minute or two later than usual, in that window only. NEXTDASH_HEALTH_STARTUP_GRACE sets the window (for example 5m), and 0 switches it off. Docker, Glances and Unraid are not affected.
Expected response
On a monitored bookmark, Expected response opens a panel:
- Text the page must contain — a phrase that only appears when the page works. Fail if present instead reverses it.
- Status codes that count as healthy —
200,200-299,200,301,401. By default anything below 500 counts. A code that cannot be read is ignored. - Watch for redirects, retitling and rewrites — drift (Drift).
- Do not alert me about this bookmark — muting (Alerts).
Failures of these tests go to the Content filter, not Broken. Clearing both test fields clears the failure.
The same address on two pages. It is checked once per round. A copy with its own expected response, drift setting, check address or credential is checked with those too, and gets its own result; uptime, history and alerts stay one per address, from the first copy.
Pages that say "not found" with a 200. With Spot pages that answer 200 but say "not found" on, a monitored check reads the title and opening text for a not-found message in five languages, and once a day per site asks the host what it does with an address that cannot exist. A site that sends everything to a sign-in page is left alone.
Drift
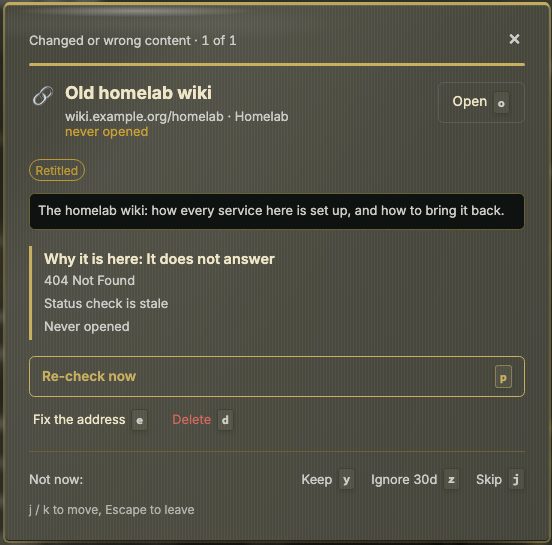
Drift notices a page that still answers but is no longer the page you saved. Tick Watch for redirects, retitling and rewrites on a monitored bookmark. The next check becomes the baseline; every later check is compared with it.
- Redirect drift — the link lands somewhere else. http→https,
www., trailing slashes and tracking parameters are ignored. - Title drift — the title changed. Titles like Domain for sale or 404 are named outright.
- Content drift — the text became a different page.
One finding per check, in that order. The row badge reads Moved, Retitled or Changed; the Drift filter (reached from Collection health → what is wrong, by kind, or #bookmarks?health=drift) lists them. A page that returns to its baseline clears itself. Accept drift on selected rows clears the finding and drops the baseline, so the next check records the page as it is now. Drift reads the page body, so it is opt-in and for monitored bookmarks only.
Alerts
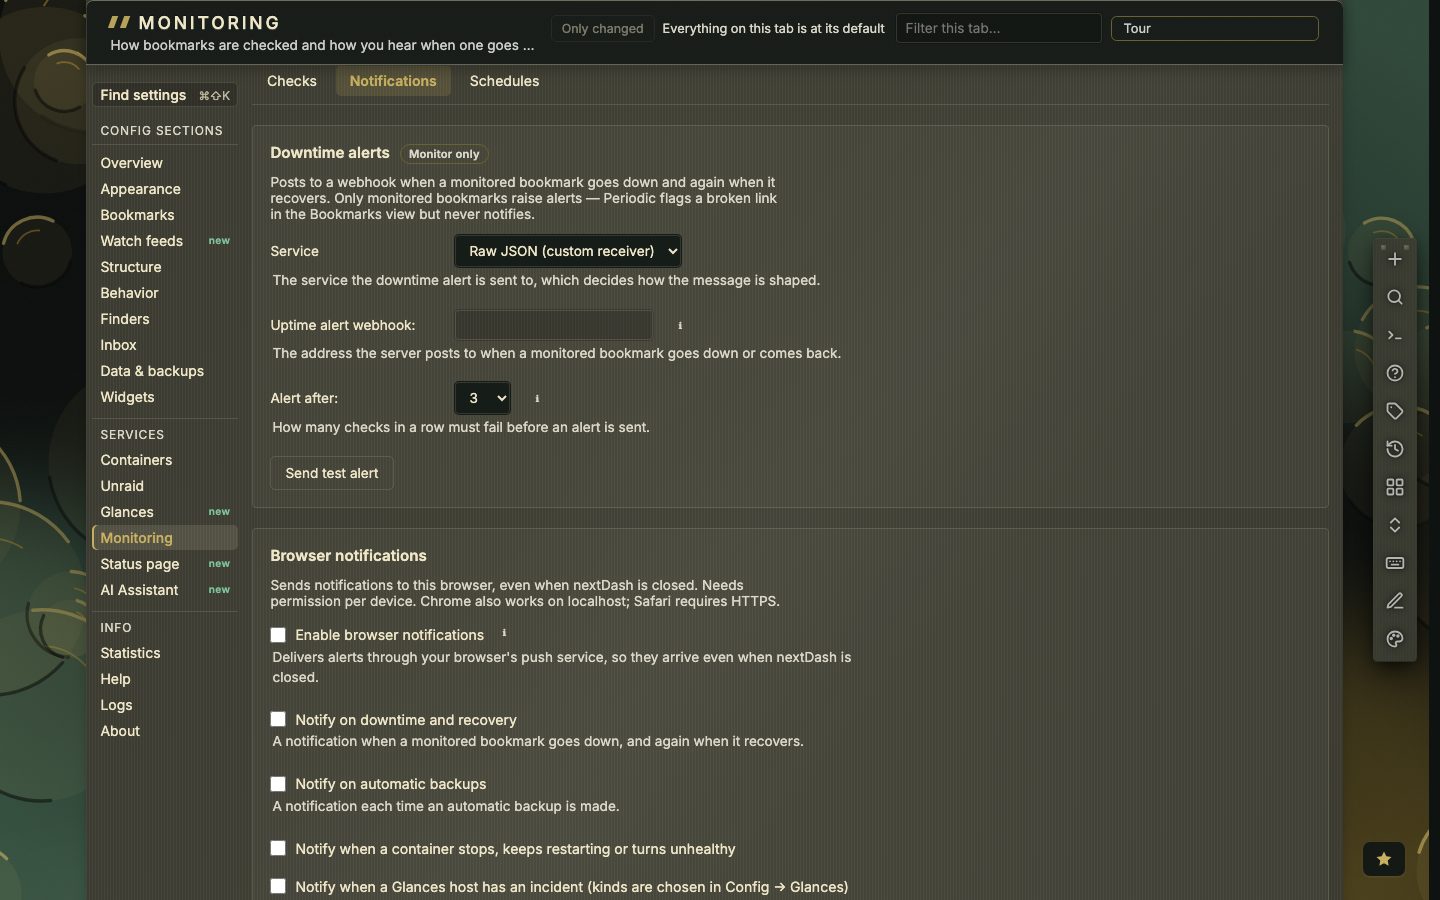
Downtime alerts (Monitoring → Notifications) post when a monitored bookmark goes down and again when it recovers, with how long it was down.
| Service | Needs |
|---|---|
| Slack, Discord | Webhook URL |
| Telegram | Bot URL and chat ID |
| Gotify, ntfy | URL |
| Pushover | Application token and user key |
| Apprise | The notify URL of a configuration key on your apprise-api (http://apprise:8000/notify/<key>), and optionally a Tag |
| Raw JSON | Your own receiver's URL |
- Apprise passes an alert on to everything it reaches — mail, Matrix, Signal, Teams and a hundred more — and keeps those services' passwords itself. A Tag sends only to the destinations that carry it. Send test alert explains Apprise's refusals: 424, it could not deliver or no destination had the tag; 404, there is no configuration under that key.
- Alert after — failures in a row before a bookmark counts as down (default 3, 1–10).
- Send test alert — sends one made-up failure the same way a real one goes.
- ntfy alerts carry Open link and Health buttons, and a failure is sent at a higher priority than a recovery. Fill in Address of this dashboard for the Health button; it links to
/#health, which redirects into the Bookmarks view. - Local addresses are refused unless Allow local bookmarks is on.
- Many at once — when a host takes many bookmarks down together, the alerts are collapsed into one message. Certificate warnings are always separate.
- Certificates — by default warnings at 30, 7 and 3 days before expiry; Warn about certificates (Monitoring → Checks) offers Default (30 days ahead) or n days ahead (3 to 120), and the two later warnings follow in the same proportion. They go through the same channels, and to any webhook subscribed to
health.cert-expiring(Data, backups and import › Webhooks). - Domains — the registration behind your bookmarks, looked up through the registries' public RDAP service. On by default; Monitoring → Checks → Look up when my domains expire switches it off. Only the domain names of checked and monitored bookmarks are looked up, one request per domain a day, and each name goes to the registry of its extension (Verisign for
.com, for example). Warnings come at 60, 7 and 3 days (Warn about domains moves the first), by the same channels, and to any webhook subscribed tohealth.domain-expiring. Not every registry publishes a date:.nlanswers without one, and.de,.io,.be,.euand a few others have no RDAP service. Those domains are listed as having no date and are never warned about. In the Bookmarks view a bookmark whose domain is close gets a Domain badge, and the Domains filter lists them.
Muting one bookmark. Tick Do not alert me about this bookmark in its Expected response panel. It is still checked and shows as down with a Muted badge; only the message is held back. Un-muting during an outage still alerts. Mute alerts and Unmute in the Bookmarks view's selection bar change several rows at once.
Browser notifications reach a device even with nextDash closed. Switch them on from the dashboard card or under Monitoring → Notifications, then press Enable on this device and allow notifications. A test notification follows. Contact address for push services (under Monitoring → Notifications, with these settings) is an address push services can reach you at if a notification is misused; some of them require one.
| Notifies about | Default |
|---|---|
| Downtime and recovery | On once enabled |
| Automatic backup results | Off |
| A new release | Off |
They need a secure context: Safari and every browser on iPhone and iPad require HTTPS (not http://localhost); desktop Chrome, Edge and Firefox also accept http://localhost. On iPhone and iPad, add nextDash to the home screen first. Subscriptions live in data/push-subscriptions.json; deleting it unsubscribes every device. Show the invitation again brings the card back.
📷 Screenshot — the downtime alert settings
Weekly digest. Once a week nextDash sums up what needs you: links that broke, certificates that run out soon, container updates, what is worth tidying up, bookmarks nobody opens, links waiting in the Inbox, and what you opened most. It goes out on Monday at 08:00 by default, in the time zone of the quiet hours, and cannot be switched off. A fresh install gets its first digest after at least a week: a digest is only sent when its slot falls seven or more days after the install.
- Where it arrives — every week as a card, Your week in nextDash, that waits in the notifications bell once per digest and names the one or two things that matter most; and as a browser notification when those are on, through the service under Downtime alerts. A digest that falls in quiet hours waits until they end; one that came due while the server was off goes out once, when it starts. A week with nothing to say sends nothing.
- The card — Read the digest opens the window. Snooze 1 day hides the card until tomorrow. Got it marks it seen; unless you opened the window, the card returns once the next day and once the day after, and then stays away until the next digest. Progress, snooze and reminders are kept per browser.
- Reading it — along the top is the week in figures: bookmarks opened, bookmarks added, uptime with the number of outages, and the links in the Inbox with how many are new, each next to the week before (▲ and ▼, green when it went the better way). A figure with nothing behind it is left out, so a new install shows a short row. The Overview carries two charts: Bookmarks opened per day as seven bars, and Uptime per day as a line. Lines that show a number of days spell them out (3 days left, down for 2 days). The window opens on an Overview, one line per part saying where it stands, and lists the parts on the left in three groups: Needs you (broken links, certificates, domains, container updates), Tidy up (the checkup, never opened, not opened in 30 days) and Good to know (the Inbox, most opened, what is new in nextDash), with a sentence on top that names what matters most. The part you pick is shown in full on the right: what it means, the names behind the count with what matters about each — a broken link with its page, since when it is down and what the last check said; the most opened with how often; never opened with their page; not opened lately with how long ago; the Inbox with how long its oldest link has waited — certificates and domains as bars of days left, and a button to the view where you deal with it — Open in Bookmarks (with Work through for the broken links), Open Containers, Start the checkup, Review, Open Inbox, Open What's new. The close button at the top and Close at the bottom are always in view; only the middle scrolls. After a part's button the digest shrinks to a bar in the bottom-left corner: Weekly digest · 1 of 4 done, and Next for the one after; it closes itself once every part is opened. Its × asks first, because the digest may still hold something important: Keep it or Close until Monday. Clicking the push notification opens the same window.
- Setting it up — Monitoring → Notifications → Weekly digest: On (the day), At (the hour), and which parts go in — Include container updates, Include most opened, unused and Inbox, Include what is new in nextDash this week, Include what the watched feeds published; broken links and certificates always stay. The figures along the top follow the parts: uptime and outages stay with the broken links, while the opens, the added bookmarks and the Inbox go with Include most opened, unused and Inbox. The latest digest → Show opens the last one again, as does the digest panel in Config → Overview; Send a proof digest now → Send builds one from today's data and sends it, without moving the week's own digest.
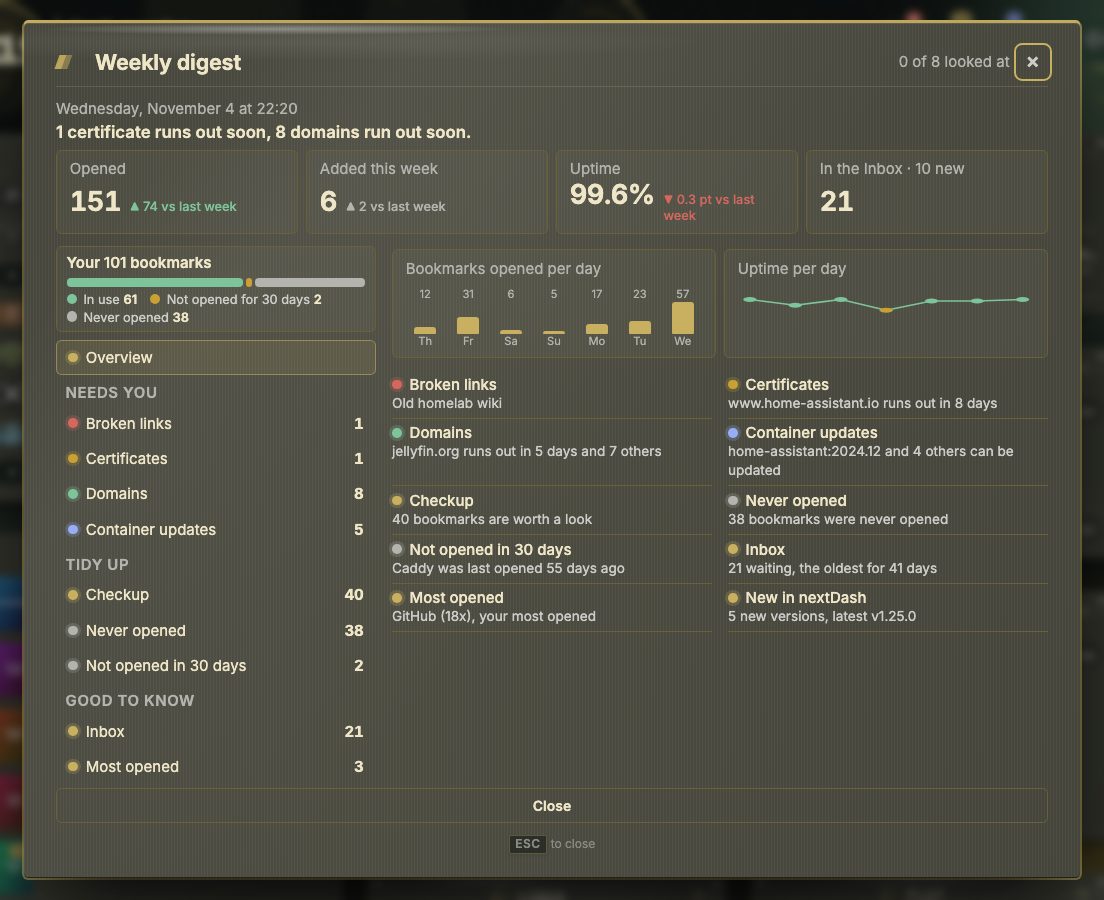
On the day the digest comes out it goes first, and the daily review card (The dashboard) waits — both offer the same broken and unopened links.
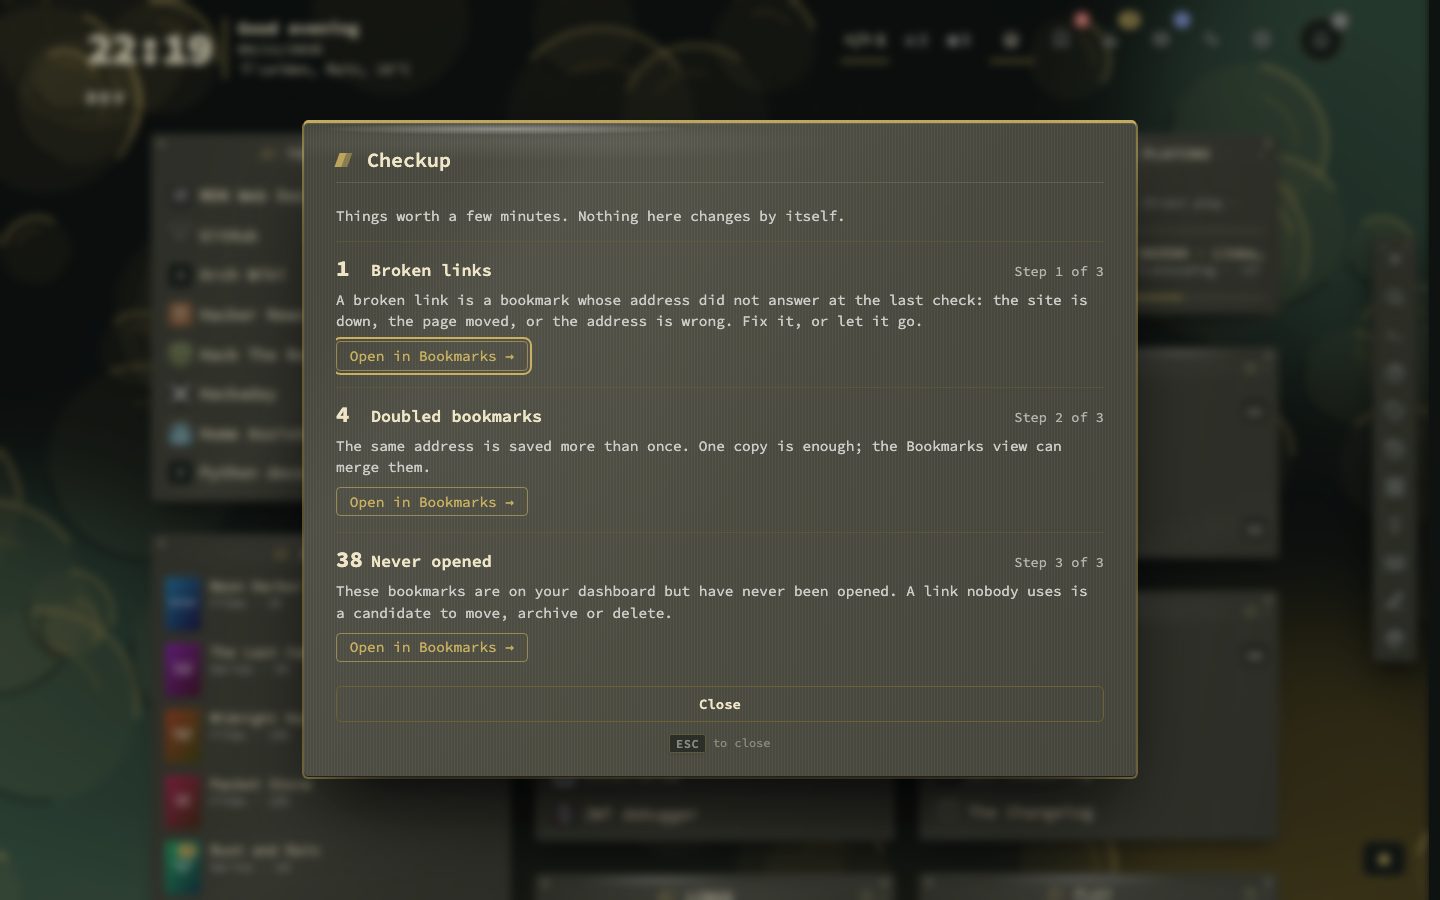
The checkup. One guided round through what is worth tidying up, on top of the Bookmarks view: type :checkup, pick Checkup in the Bookmarks view's menu, or press Start the checkup in the weekly digest. The steps are dead links, duplicates, bookmarks never opened or gone stale, categories and pages with nothing in them (hidden and snoozed bookmarks count as present, and a page with only widgets is not empty), and widgets that show an error or no data right now. A step with nothing to do is skipped, every step uses the actions you already know (delete, merge, move, edit) with their confirmation and undo, and nothing is removed before you have seen it.
Maintenance windows
A window is a recurring period when downtime is expected — days, a start and an end. Set windows under Monitoring → Schedules. An end before the start runs past midnight. The times are in your time zone: the browser's zone is saved with the windows when you change them, so a window you set for 02:00 is 02:00 where you are, even when the container itself runs on UTC. Windows apply to every monitor. Quiet hours use the same clock.

Inside a window, checks still run and the heartbeat still records them, but a failure opens no incident, does not count against uptime or toward the failures an alert waits for, and sends no alert. A failure that continues after the window raises the alarm as usual.
Quiet hours. Under Monitoring → Schedules → Quiet hours, Hold notices during quiet hours holds alerts from monitors, containers, Unraid and backups while a window is open — the same editor as maintenance windows. When the hours end, one summary says what is still going on and what recovered by itself. Unlike a maintenance window the downtime still counts. Always let through lists the kinds that break the quiet: an expired certificate, a mass outage (several at once) and a failed backup by default, and a container that stops or restarts if you tick it. A line under the list says whether it is quiet now, until when, and how many notices are held. Outgoing webhooks (Data, backups and import › Webhooks) are outside it and get every event. A muted bookmark or container never raises a notice, and a maintenance window drops it before the quiet hours would hold it.
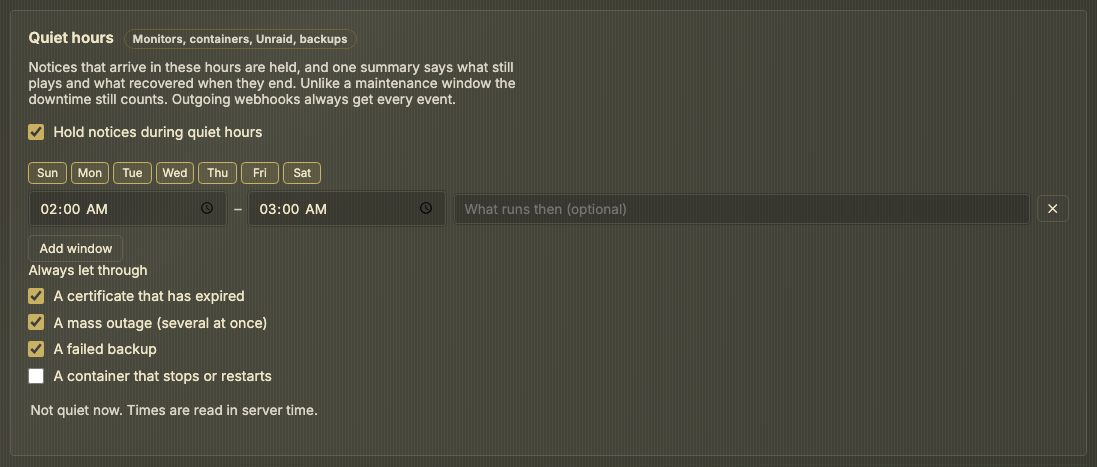
Reminders. Remind me about an outage that is still going sends another message for a monitor or container that is still down: Remind after 15, 30 or 60 minutes, or 2 or 4 hours, At most 1, 2, 3 or 5 times. Not during quiet hours; the summary that ends them says what is still down.
Uptime badges. Serve uptime badges (off by default) lets /badge/uptime.svg?url=<address>&days=7 (or 30) return a small SVG for a README or a forum post: the uptime percentage, green from 99.9 %, amber from 99 %, red below. It answers for monitored addresses only; any other address reads no data, so the badge never tells whether an address is known. Anyone who knows a monitored address can read its badge, which is why it is off until you switch it on. A monitored bookmark's Health tab in the Bookmarks view has an Uptime badge section with a preview, a choice of 7 or 30 days and two buttons, Copy Markdown and Copy HTML, that put the snippet for your server on the clipboard. While badges are off the section says so and has a button to the switch.
Keeping a copy of a page
Set up under Data & backups → Sources.
- Web Archive — Archive new bookmarks asks the Internet Archive to keep a copy the day you save a link. An archive.org key pair (archive.org/account/s3.php) raises the daily allowance; Save a copy… tests it. The panel says what became of a capture.
- Local copies — saves a whole page (text, styling, images) as one file in your data directory, using monolith, which the container includes. Pages up to 52 MB. For a page that is not a bookmark, paste its address in Page to save and press Save a copy…. Bookmarks → Local copies lists copies per bookmark, says why a copy failed or saved an empty page, and can remove them all (it says how much space that frees).
- archive.today — a second archive that keeps what it captured.
On a bookmark's Health tab, Find in Web Archive reads the archive's index for the last capture that was a real page.
The status page
The status page is one page behind a secret link, for your household and friends. It answers "does it work?" before anyone asks: which services work, since when one is down, planned maintenance, and 30 days of history. No accounts and nothing to change: visitors only read. You choose the groups and the names they see. Light or dark and the language follow the visitor's device. Set it up under Config → Status page.
What a visitor sees. Your title and notice, one line for the whole page (All services are working, or how many have a problem), then your groups. Per service: its public name, its state (Operational, Degraded, Down, Maintenance or Unknown), Down since 14:03 while it is down, a bar for each of the last 30 days with the uptime percentage, and planned maintenance for the groups you linked. A link to the service and its response time show only when you switch them on. A service with no check for a while reads Unknown with the time of its last check. The page refreshes itself every minute.
What a visitor never sees. Error details, container images, bookmark ids, internal addresses (unless Link is on for that service), or anything else of your dashboard. The page loads none of the dashboard's files.
Setting it up.
- Under Link and access, tick Turn the status page on. The link appears with Copy, Open and a QR code to scan with a phone.
- Under Top of the page, give it a Title and, if you like, a Notice shown under it.
- Under Groups and services, + Add group, then + Add service in each group. The picker lists monitored bookmarks and containers; a bookmark without monitoring has no history to show, so it is not listed. A bookmark linked to a container (the same pairing as in the Containers view, Containers) is offered as one service, and the worse of the two counts. The pairing is fixed when you add it. Give each service a Public name, and tick Link and Speed where you want them.
- Under Maintenance shown on the page, tick the groups each maintenance window belongs to. The windows themselves are set in Monitoring → Schedules (Maintenance windows). A linked group shows Planned maintenance ahead of time and blue instead of red during it. Alerts are not affected.
Everything saves as you go.
Who can open it. Anyone with the link. New link… makes a fresh one and the old link stops working at once — use it when the link went further than you meant. Only from the home network refuses visitors from outside your own network. A wrong, old or stopped link gets a plain not found. A backup keeps the page's layout but never its link, so after a restore the old link is gone: open Config → Status page and it makes a new one. Share that.
Sharing it over the internet. nextDash has no login, so let your reverse proxy pass only /s/ and /static/status/, never the whole app, and name the proxy in NEXTDASH_TRUSTED_PROXIES. The examples and the rest are in Security and self-hosting › Sharing the status page over the internet.