Statistics
Statistics counts what you have and what you use, worked out from the data on your server.
Config → Statistics counts what you have and what you use. Everything is worked out from the data on your server.
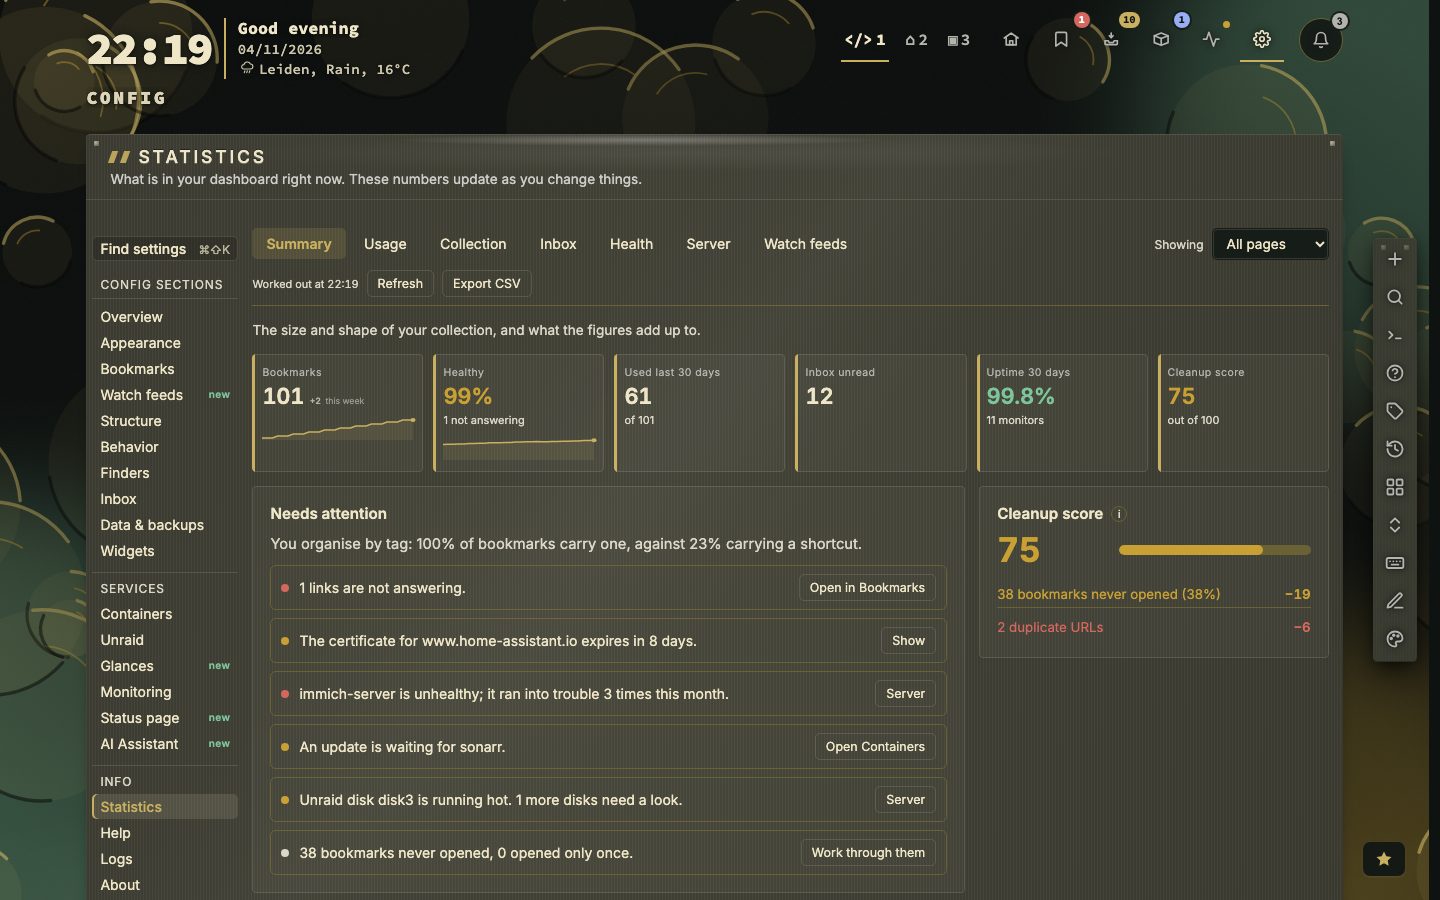
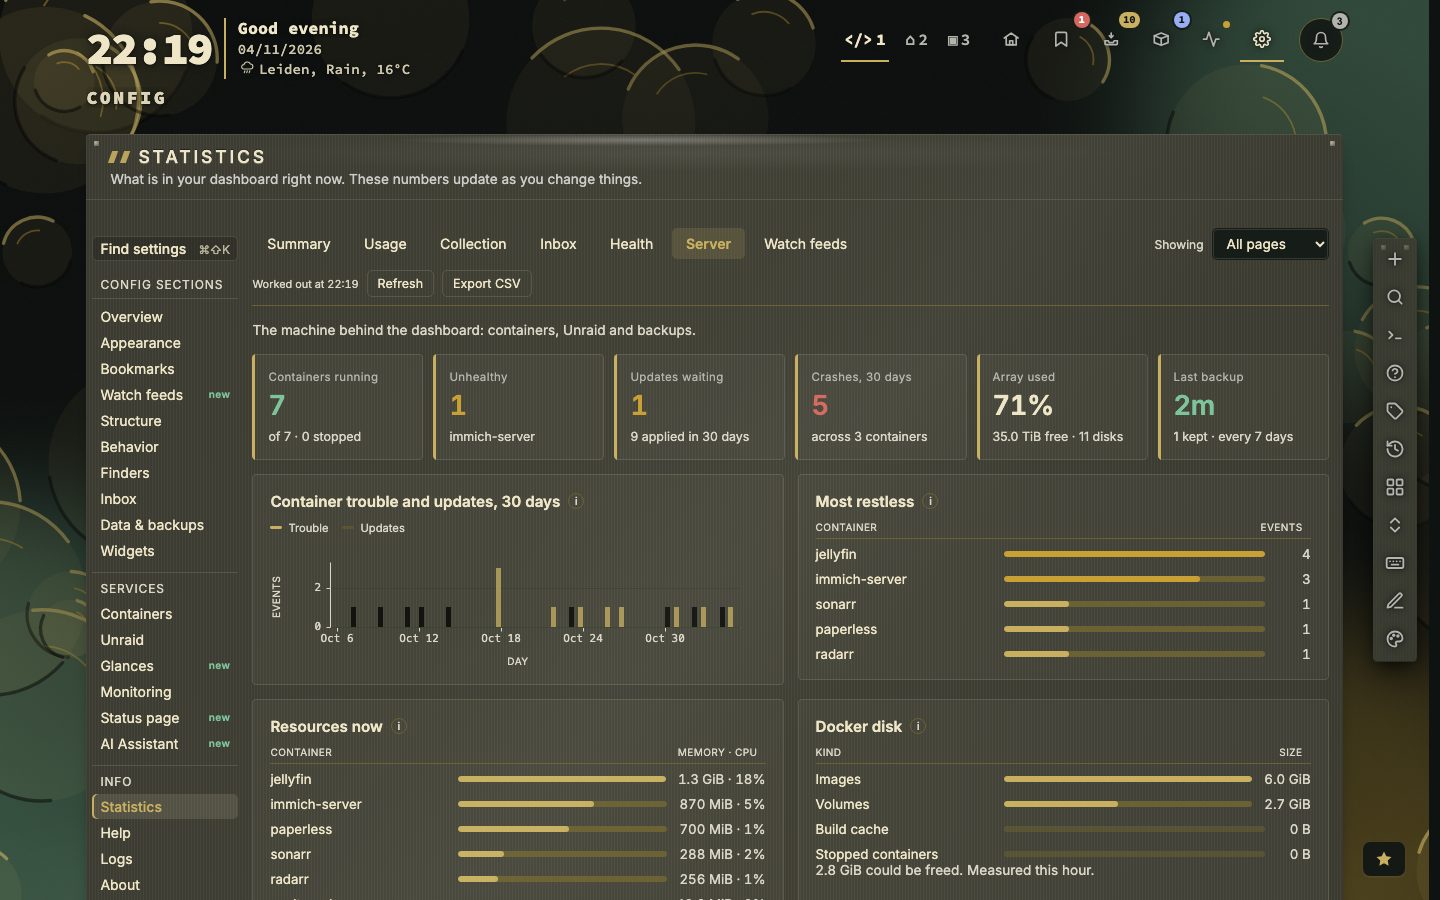
Every tab opens with a line on what it is about and a row of six figures. Below them the panels stand in two columns, and in one on a narrow window. An i beside a panel title explains what it counts.
| Tab | Six figures | Panels |
|---|---|---|
| Summary | Bookmarks, healthy share, used in the last 30 days, inbox unread, uptime over 30 days, cleanup score | Needs attention — only what is above zero, each line with its button: links not answering (the longest-broken named), a certificate close to expiry or expired, unread inbox items older than 30 days, bookmarks never opened or opened once, and — with Docker or Unraid connected — unhealthy containers, waiting updates, an Unraid disk with errors, disabled, missing, hot or full, and a late automatic backup. Cleanup score and what lowers it. Bookmarks last used, 30 days and Healthy share, each with a link to its own tab |
| Usage | Opens all time, used in 30 days, last 48 hours, top 10 share, never opened, opened once | Bookmarks used over time (7 days, 30 days, 90 days or 1 year; opens or last used), When you open bookmarks (shows from 20 opens), How concentrated your use is, Last opened, Times opened, Most opened, Most used tags, Shortcuts, Opens by page, Finders |
| Collection | Bookmarks, pages, categories, distinct tags, unique hosts (and how many are self-hosted), without a preview | Coverage (with a shortcut, an icon, checking, tags, a note), Categories: size and use, How the collection grew, Age of the collection, Top domains, Tags per bookmark, Bookmarks per page, Widgets by kind and Widgets per page, Beyond bookmarks (widgets, feeds switched off, import sources, trash, backups), Cleanup candidates (untagged, opened once, without an icon, never opened, still on http — Show opens them in the Bookmarks view) |
| Inbox | Inbox items, unread older than 30 days, oldest unread, backlog over 30 days, converted, time to triage | Inbox flow per day (7, 30 or 90 days: added, dealt with, the running backlog), Where everything went, How long unread items have waited, Inbox by source, How complete the items are. Lifetime counts live in data/inbox-stats.json |
| Health | Healthy share, broken, uptime over 30 days, average response, certificates expiring within 30 days, health score | Status now and over time (with Open Health), Certificates, Issues by type, Archive coverage, Notifications — open alerts and how long they have been down, what is held in quiet hours, push devices, webhooks, the alert service and the last weekly digest |
| Server | Containers running, unhealthy, updates waiting, crashes in 30 days, Unraid array used, last backup | Container trouble and updates per day, Most restless, Resources now, Docker disk, Unraid disks, Unraid (parity, VMs, UPS, notices), Automatic backups and Container updates. A panel without a connection says what is missing and links to where to set it up |
- Watch feeds has a tab of its own: the numbers behind Watch feeds › Managing it.
- Showing narrows every figure to one page. It appears only when there is more than one page. The inbox and the health report cannot be narrowed, and say so. The choice is not remembered.
- Tiles show the direction since last week. A tag or a table row leads to the bookmarks behind it.
- Stale follows count as neglected after under Config → Bookmarks, the same threshold the Bookmarks view uses.
- Each tab has a 🔗 to copy a link to it.
- At the top: when the figures were worked out, Refresh, and Export CSV for every tab. The export fetches the inbox and health figures itself, and adds the watched feed figures (feeds watched, items, read share, unread now, errors, and per feed and per day) while Watch feeds is on and follows a feed; otherwise it says
feeds_included,0. - A category is counted per page: the same name on two pages is two categories.
📷 Screenshot — Statistics, Usage tab, full page
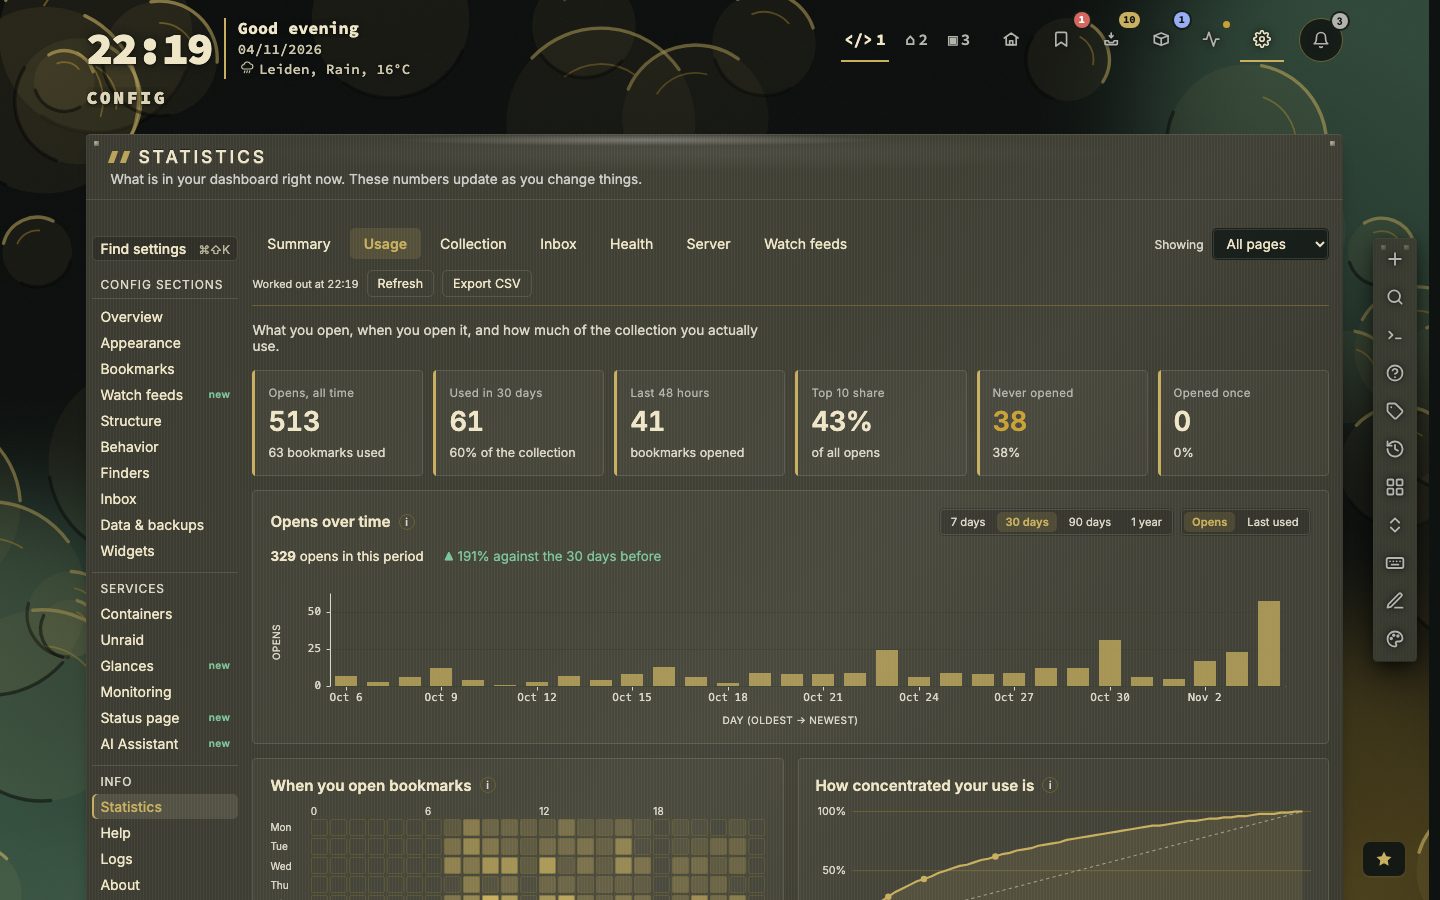
📷 Screenshot — Statistics, Health tab, full page
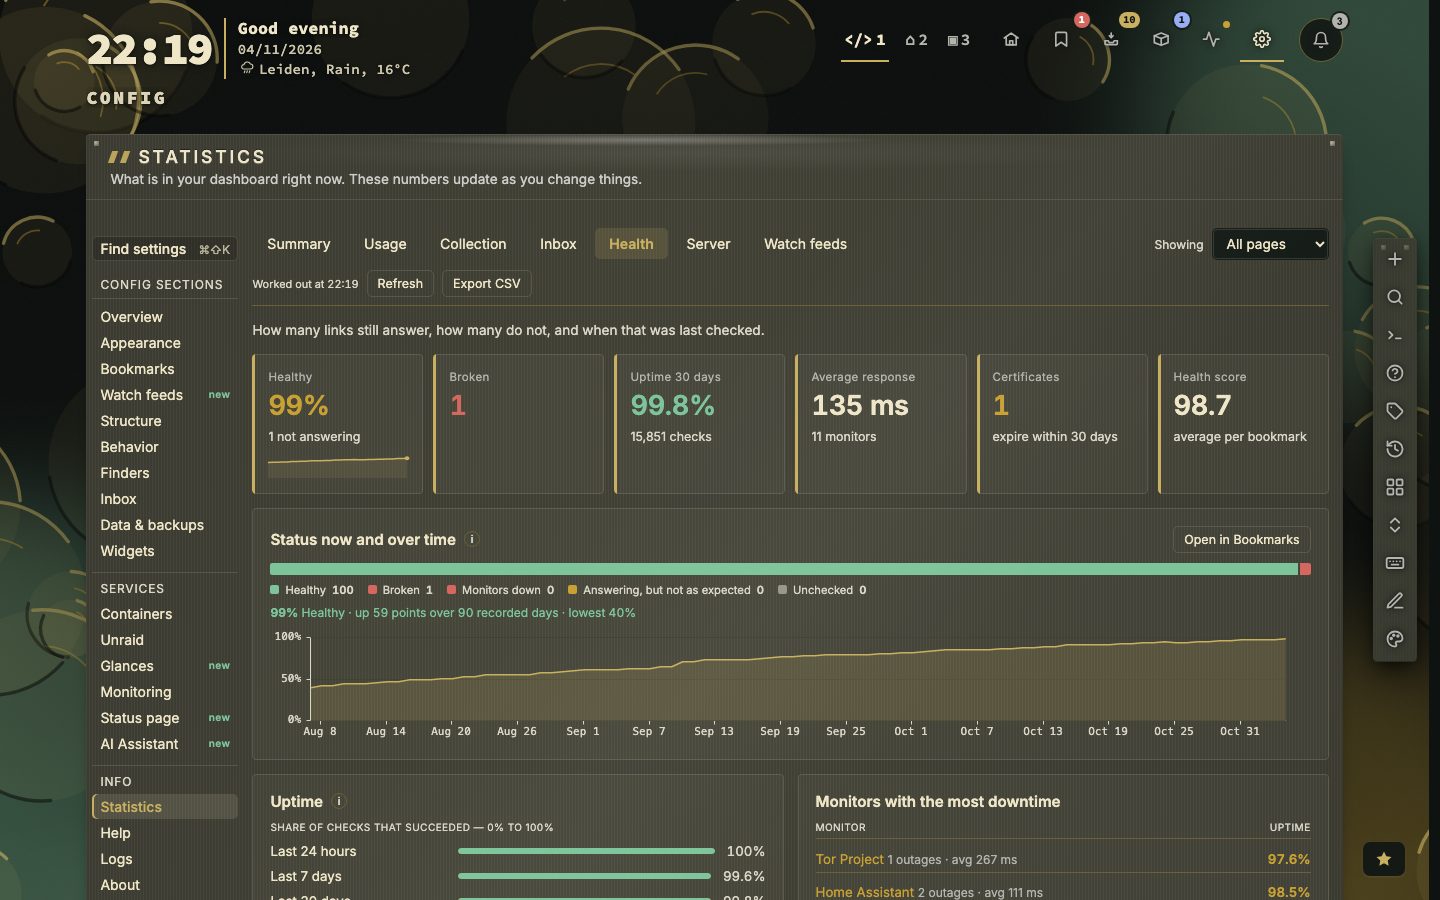
📷 Screenshot — Statistics, Server tab, full page