

Glances
The Glances page shows a machine as a Glances 4 server sees it — processor, memory, disks, processes, containers — and keeps a record of its own, with graphs, incidents and a forecast for filling disks. nextDash only reads. Set it up in Config → Glances.
The Glances page shows one machine at a time: how busy it is right now, what runs on it, and how it looked an hour, a day or a month ago. The figures come from a Glances server that runs on that machine; nextDash reads from it and never changes anything there. Because Glances itself forgets quickly, nextDash writes down what it reads and keeps thirty days of it, on the server, whether or not the page is open.
IMPORTANT
It needs a Glances server that is already running — nextDash does not install or start one. See What it needs.
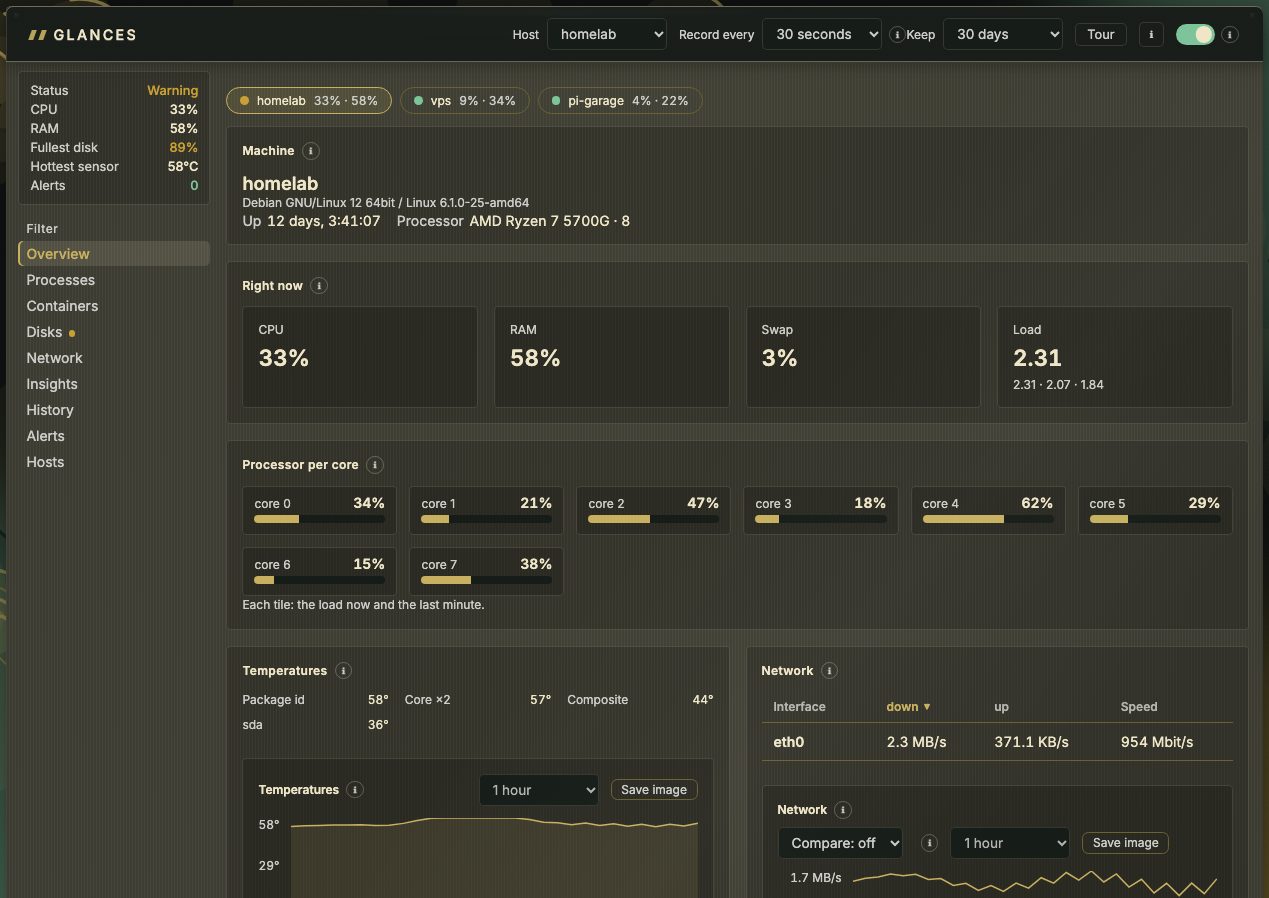
Opening it
Once it is set up, a Glances icon sits in the header before Config, with a small dot for how the machine is: green, yellow or red. Click it, press Shift + G, or open /#glances. :glances in the command palette opens the page too; :glances processes (or any section name) opens that section, and :glances host <name> another host. Until Glances is switched on in Config, there is no icon, the key does nothing, and nothing about Glances runs.
A page that is not set up yet says so, with a button to Config → Glances.
The head of the page has, from the left: the Host menu (with more than one host, Several hosts), Record every and Keep (The record, History and incidents), Tour, an ℹ that explains the page, and the connection switch. The ℹ buttons beside each block explain it in a few lines and, for the cryptic ones, link to a longer explanation. The card at the top left sums the machine up: Status, CPU, RAM, Fullest disk, Hottest sensor and Alerts.
What it needs
| What | Why |
|---|---|
A Glances 4 server, run in web mode (glances -w, or the Glances container, which serves on port 61208) | nextDash reads its JSON API under /api/4. Glances 3 answers differently and is refused: This view needs Glances 4 |
Its address in Config → Glances, for example http://192.168.1.10:61208 | Test connection says what answered, or why not |
| Allow localhost & private-network bookmarks switched on in Config → Behavior | A machine on your own network is refused until it is. The error says so in words |
| The write token, if the install has one | Saving settings, the command line of a process, recording a process or container, deleting what was recorded, and the :glances commands that change something ask for it. Looking does not |
A login is only for a Glances server that has a password; the password is kept on the server and never sent back to the page. nextDash asks Glances only for what it shows: the sections in the menu are the ones the host can answer, so a host without the containers plugin has no Containers section.
The sections
The menu on the left has one section per screen. Each has a key:
| Section | Key | Shows |
|---|---|---|
| Overview | o | The whole machine at a glance: Machine and uptime, Right now (processor, memory, swap, load), the load of each core, temperatures, network, disk activity, disks, disk health (SMART), the busiest processes, containers and alerts |
| Processes | p | Every process, with search and sort |
| Containers | c | The containers Glances sees: status, uptime, CPU, RAM, disk and network |
| Disks | d | Usage by role — array, cache and pools, system — with when each is full, disk I/O, SMART and RAID |
| Network | n | Speed in and out per interface, connections and Wi-Fi |
| Insights | i | What nextDash works out itself, from its record |
| History | h | The graphs |
| Alerts | a | The alerts Glances itself raised, ongoing and recent |
| Hosts | m | Every host in one table; only with more than one host |
Which blocks the Overview draws is a choice in Config → Glances → Page (Overview shows). A block the host cannot fill is left out. Colour follows two lines, Yellow from and Red from, which Config sets for the processor, memory, swap, disks and temperature; a sensor that reports limits of its own uses those. They colour the page, the dot on the icon and the incidents. Temperatures are written in the weather's unit: with Fahrenheit picked in Appearance → Date & weather, the page shows °F, while the temperature lines in Config stay in Celsius.
Processes has a search bar (/), and a click on a heading sorts by it. A row opens a side panel with two tabs:
- Overview — its details (PID, user, status, threads, CPU, memory, resident and virtual size, CPU time), and its Command line. The command line is read on request and behind the write token, since it can hold a secret.
- History — its graph, recorded only when you switch Record history on: reading every process and container costs the host some processor. At most fifteen at a time. All processes with one name are recorded together. Stop recording history turns it off.
The ⋯ in the panel's head copies the name or the PID, and for a container shows it in the Glances list or Open in Containers (The Docker host).
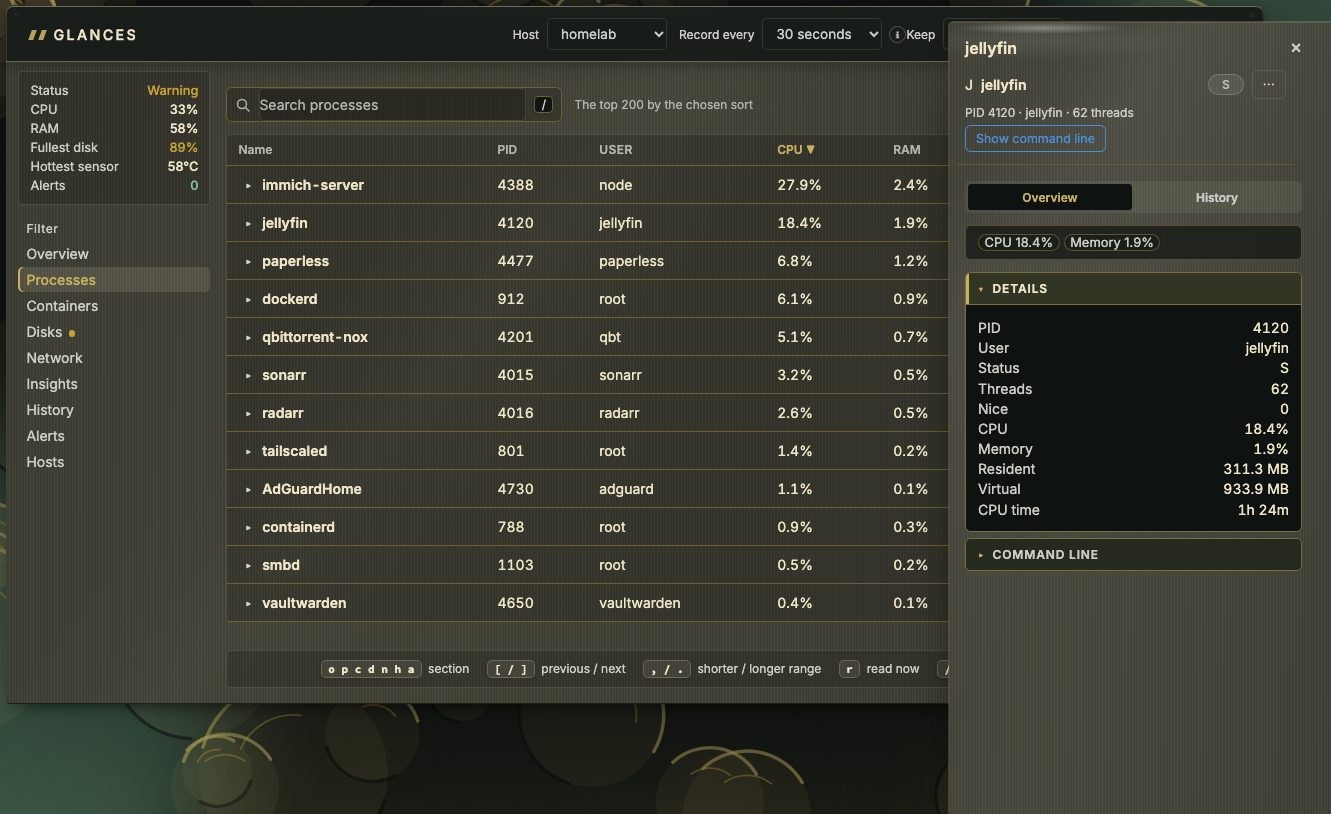
Containers lists the containers Glances sees; a ↗ opens the same container in the Containers view when nextDash manages that machine's Docker (The Docker host). A container's side panel has the same two tabs.
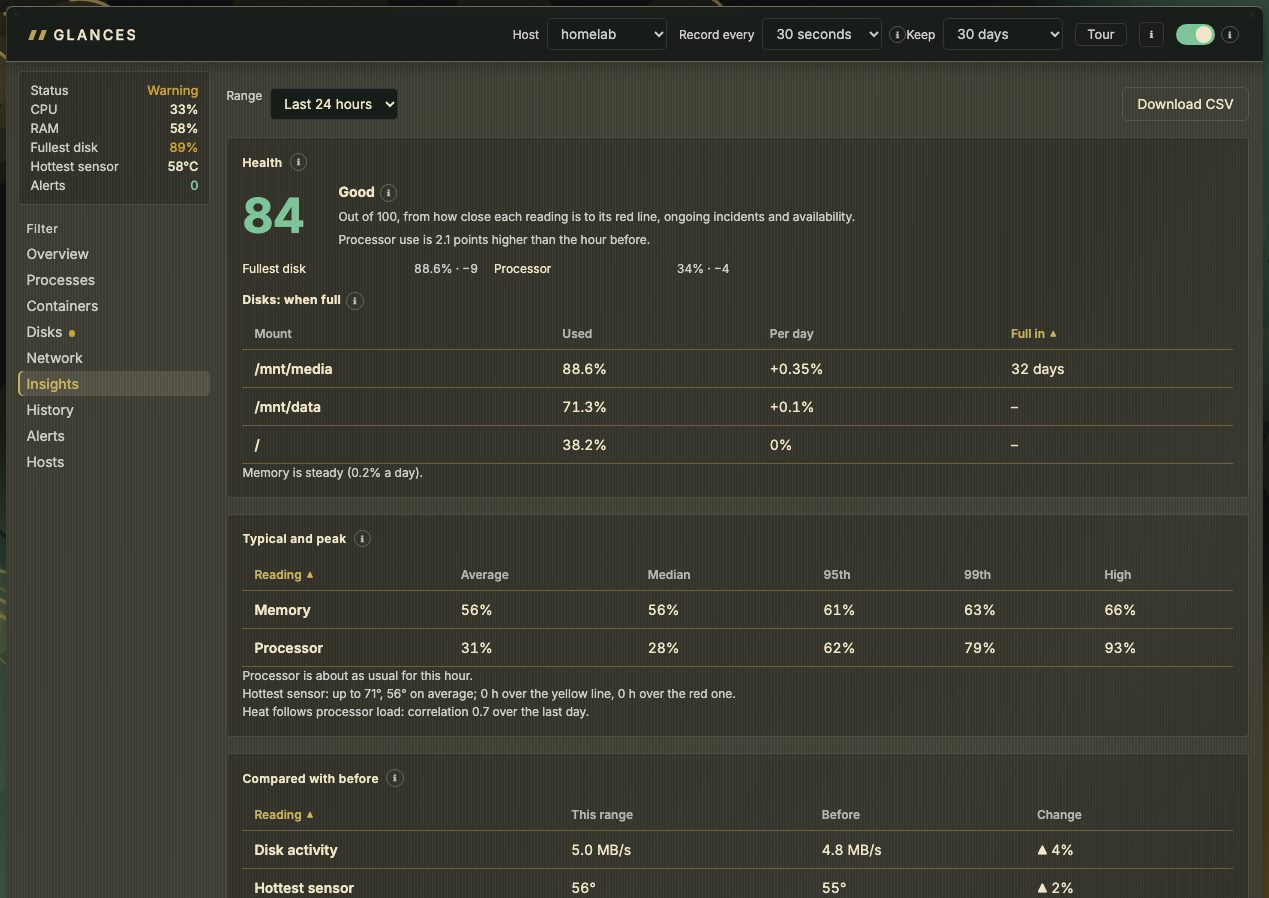
Insights has a Range (24 hours, 7 or 30 days) and Download CSV, and answers in blocks. Each block has an ⓘ beside its title that says in two or three sentences what it shows. The blocks are:
- Health — a score out of 100, from how close each reading is to its red line, ongoing incidents and availability (85 and up is good);
- Disks: when full — a straight line through the last week of each disk's use;
- Typical and peak — average, median, 95th and 99th percentile;
- Compared with before — the average of each reading over the range, set against the same length of time right before it, with the change in percent; it needs twice the range of record;
- Busy hours — one square per hour of each day;
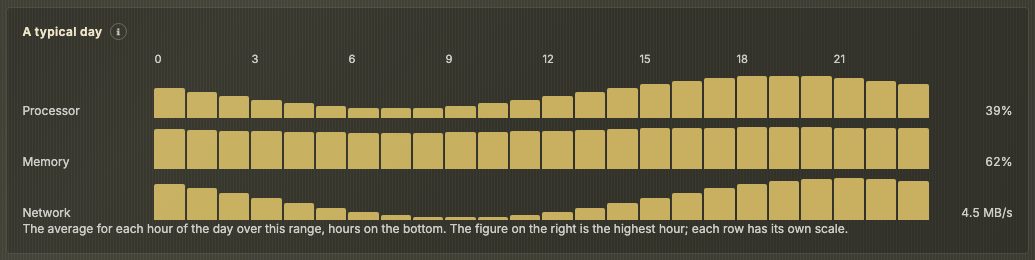
- A typical day — the average for each hour of the day, one bar per hour, with the highest hour on the right; it shows when the machine is busy or quiet;
- Peaks and rhythm — the busiest and the quietest hour of the day, and the moments a reading rose far above its usual level, with the busiest process or container of that moment when its history is recorded;
- Load and cores — the 1, 5 and 15 minute load against the number of cores the host reports, also on a machine with more than 32, and each core's average with its peak as a tick;
- Memory and swap — where the memory goes on average (in use, cache, free), how long the swap was in use, and who used the most memory;
- Temperature per sensor — every recorded sensor, hottest first, with the time it spent over the yellow line;
- Disk space over time and Disk activity — how much each disk filled up over the range, and what it read and wrote per second;
- Network per day and Network per interface — what the network carried, and the containers with the most traffic;
- Availability — a block per quarter of an hour, with the outages of the range counted underneath;
- Incidents — with a summary line per kind;
- Who used the most — over the processes and containers whose history you recorded.
A block with too little behind it is left out.
The record, History and incidents
Record every, at the top of the page, picks how often nextDash reads the host: 2, 5, 10 or 30 seconds, 1, 5, 15 or 30 minutes, or an hour — 30 seconds to start with. Longer asks the host less and fills the record more slowly; a very long pace leaves the short graphs empty. Keep picks how long it is kept: 7, 30 or 90 days. Recent minutes are kept as they were, a day is averaged, older is averaged more, so a month stays small. The record keeps going with the page closed. A host that did not answer leaves a gap, not a line down to zero.
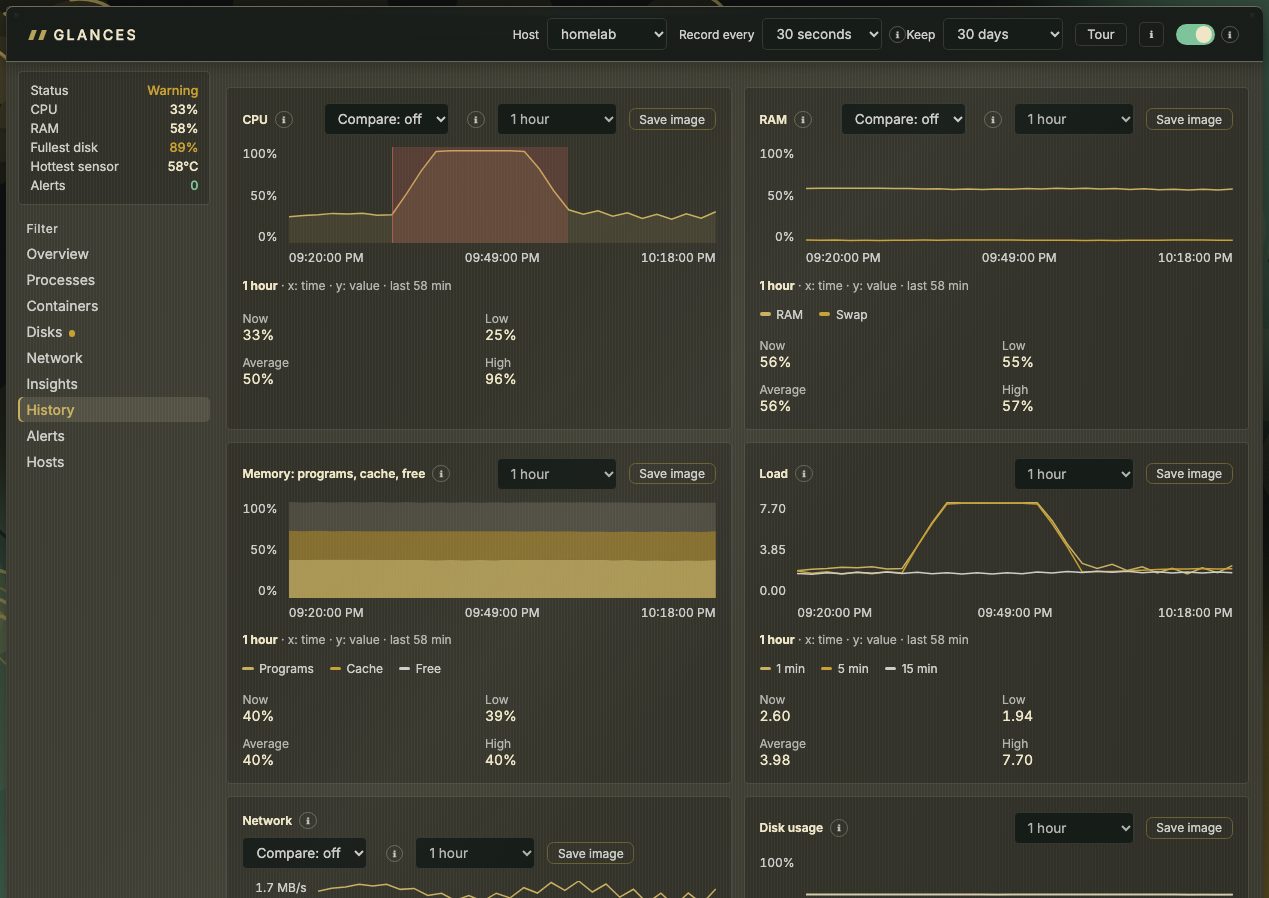
History draws a graph per kind of reading: processor, memory (and swap), memory in parts, load, network, disk I/O, disk usage and temperatures. Each graph has its own range, from a minute up to the retention, and , and . make the one under the pointer shorter or longer.
- Compare — Compare with lays Yesterday or Last week behind today as a dashed line, where the record reaches back that far (yesterday for a range of a day or less, last week for a week or less).
- Save image keeps the graph as a PNG. It is made in the browser; nothing is sent anywhere.
- Red bands are incidents: moments a reading stayed past its red line for a few readings in a row. The processor, memory, swap, a disk, a temperature, or the host not answering each opens one, and each ends when the reading is back. A dashed line is a moment a container started again.
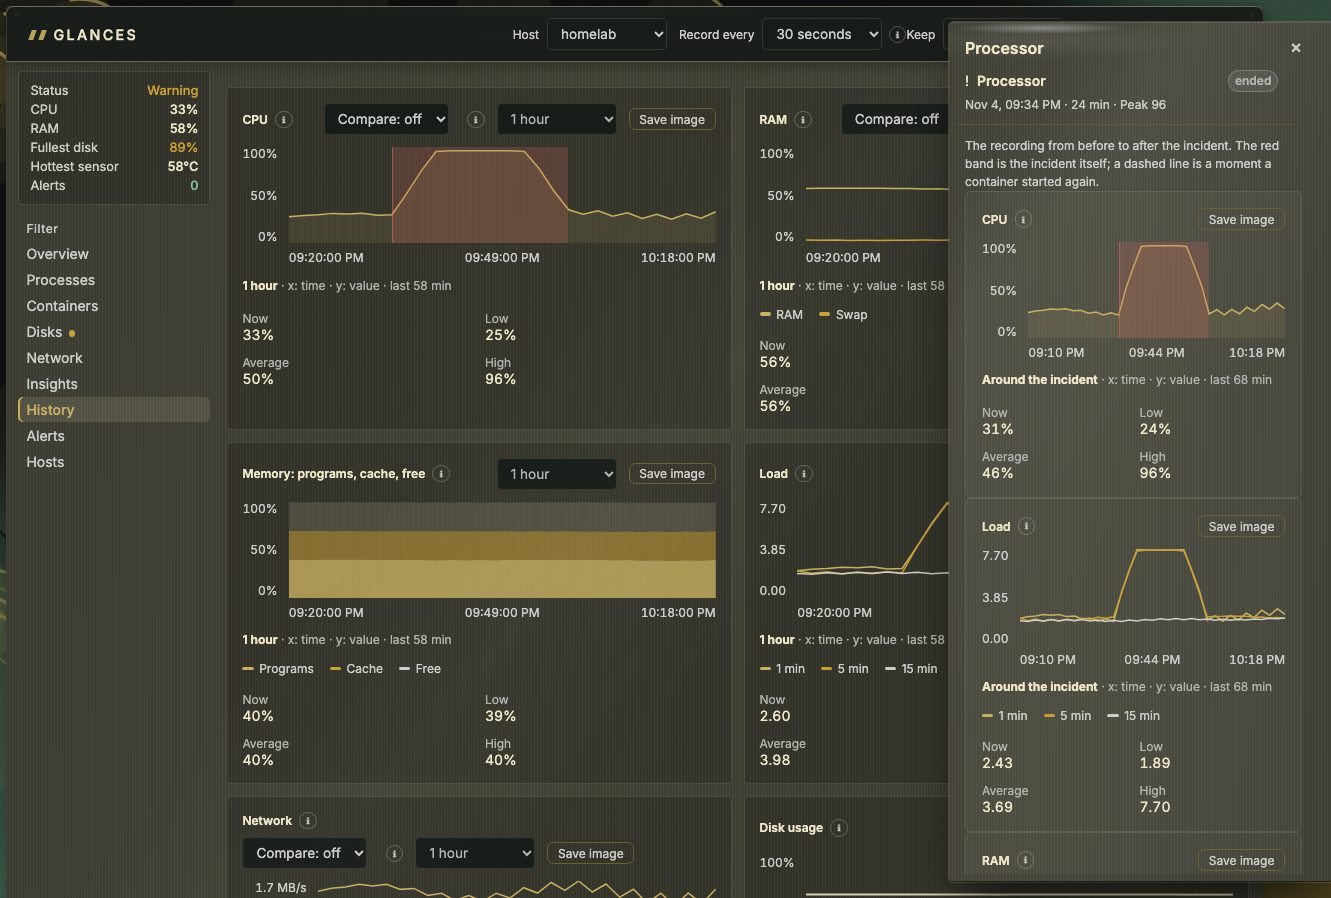
A click on a band opens the incident in a side panel: the graphs from before to after it, the containers and processes whose history is recorded beside them, and any container restarts. An incident on the processor names who was busiest at the time. Insights lists them all (The sections); they are kept for thirty days.
📷 Screenshot — an incident, in its side panel
Processes and containers are recorded only when you ask, from their side panels. Config → Glances → Recording → Record the busiest by itself can also record the 3 or 5 busiest by itself; the ones you chose stay recorded, and the host is then read on every beat.
Several hosts
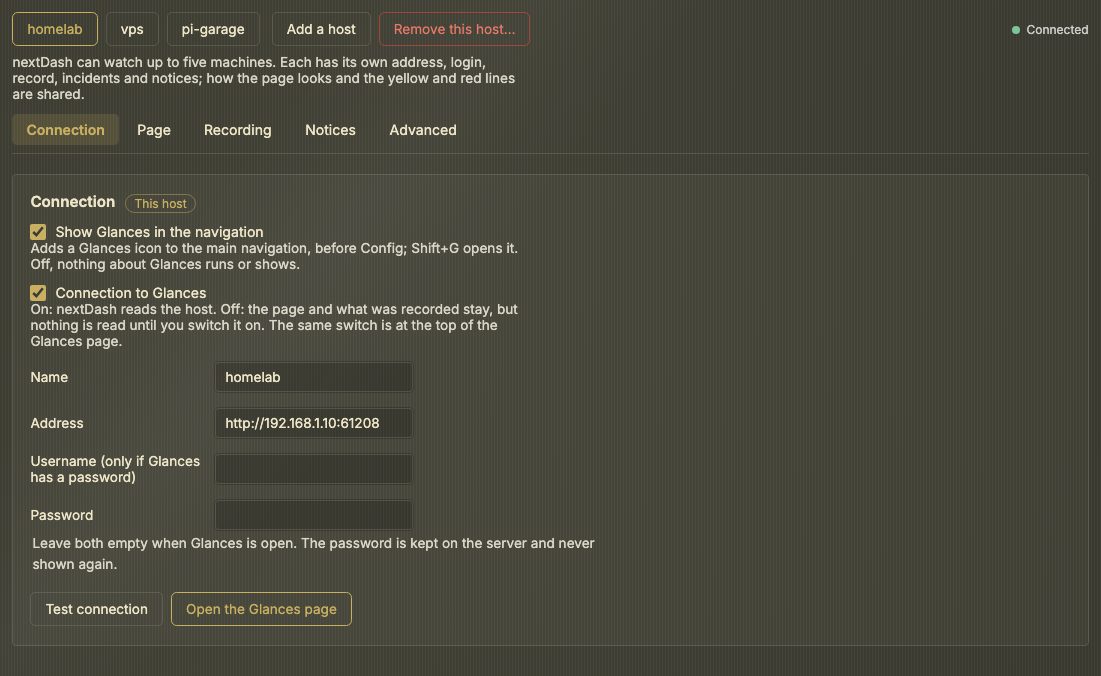
nextDash watches up to five machines. In Config → Glances there is a button per host, Add a host and Remove this host…; removing one deletes what was recorded about it. Each host has its own address, login, record, retention, incidents and notices. How the page looks and the yellow and red lines are shared.
With more than one host:
- the head of the page has a Host menu, and the address carries the choice:
/#glances/overview?host=nas; - the Overview starts with a strip with a chip for each host;
- the Hosts section (
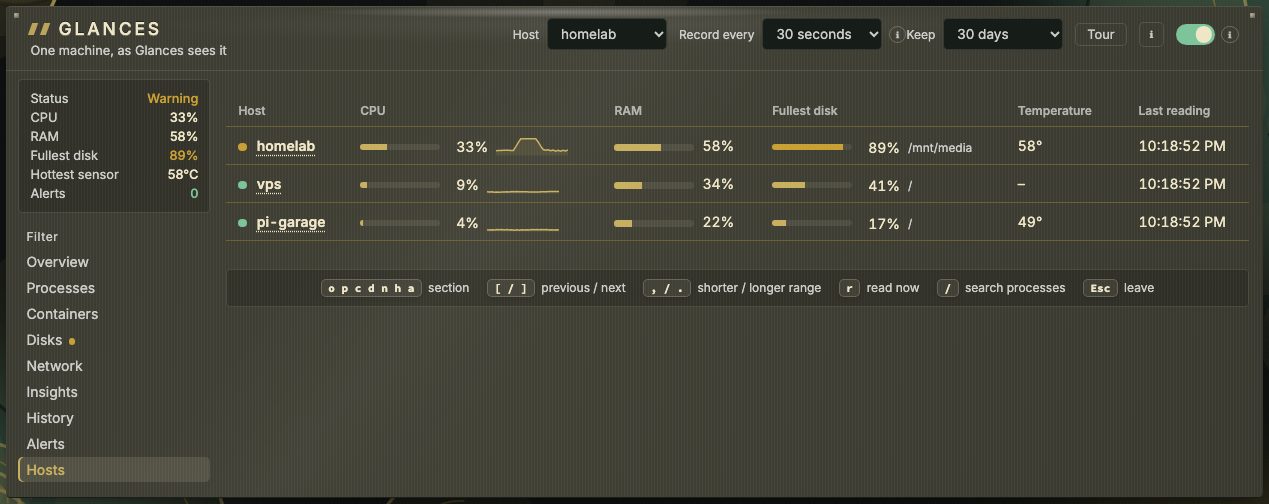
m) lists every host in one table — how it is, processor (with a small line of its last hour beside the meter), memory, the fullest disk and where it is mounted, temperature and when it was last read. It comes from the record, so it costs the hosts nothing. Trouble comes first: a host that stopped answering, then red, yellow and healthy ones, and last what is switched off or has no address. The headings sort, as in the other Glances tables. A click on a row opens that host;:glances host <name>does the same; - a host without an address is a row that says so; the others keep working.
The Docker host
When a Glances host runs on the same machine as the Docker host the Containers view manages (Containers), their containers are the same ones. Config → Glances → Advanced has Same machine as the Containers view: Auto compares the host names, Yes and No decide by hand, and a line says what was detected and what matched (by id first, then by name or port). What matched lists the containers only one side knows. Only one host can be the Docker host; Yes on one releases the others.
Then the two views meet:
- a ↗ in the Glances Containers section opens the container in the Containers view, and the Containers side panel opens it back — it has a From Glances part with what Glances recorded about it;
- the moments a container restarted are marked on the Glances graphs;
- when the two are linked but not one container could be paired, Config → Glances → Advanced and the Containers view say why: the containers could not be read from Glances, they could not be read from Docker, or both lists have containers and none belong together (check that this Glances runs on the machine whose Docker the Containers view reads);
- Use Glances for the CPU, memory and network in the Containers view (on by default) lets the Containers view ask Glances once for every container instead of asking Docker for each. Containers Glances does not know — or does not give a core count for — are still read from Docker, and so is everything when Glances does not answer within a few seconds.
The widget
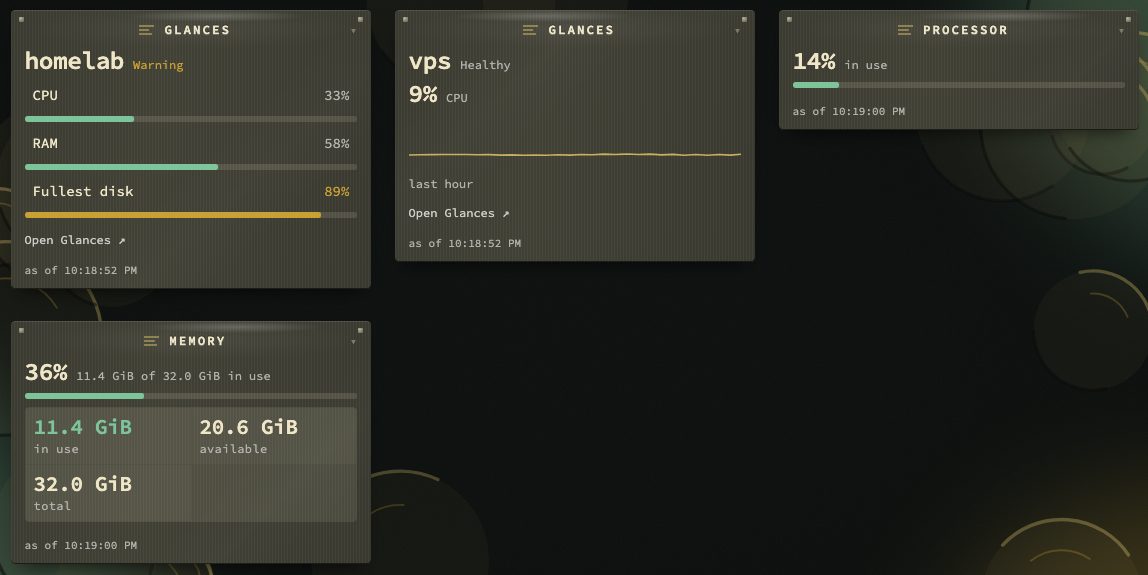
The Glances widget puts one host on the dashboard, from nextDash's own record — it asks nothing of the host. It has two looks, chosen in its settings, with the host to show (The first host until you pick one) and how often it redraws:
| Look | Shows |
|---|---|
| Three meters | How the host is (Healthy, Warning, Critical), then processor, memory and the fullest disk as bars, amber and red by the lines in Config → Glances |
| Processor graph | The processor as a number, with its last hour behind it |
A click on Open Glances ↗ opens the page on that host. A host that does not answer says so and since when, and never prints the figures it had before it went away; a host without an address, one that is not in Config any more, and no Glances at all each say so too (Widgets › The kinds).
Notices
Notices are off until you switch them on, one kind at a time, in Config → Glances → Notices, for each host: the host stops answering; the processor goes past its red line; memory or swap does; a disk does; a temperature does; and A disk is on its way to full within a week.
One notice goes out when an incident opens and one when it ends, not one per reading, and a reading that keeps swinging is announced at most once in ten minutes. They go to your alert channel (Config) and, with Notify when a Glances host has an incident switched on in Config → Monitoring, to browser notifications. Quiet hours hold them like the others.
The disk notice goes out once when the forecast says so, and again only after the disk has moved well away from it.
The tour
Tour, in the head of the page, plays a six-step walkthrough with moving drawings: the page at a glance, the keys, the side panel, the record, incidents, and several hosts and the Containers view. It is offered once on your first visit; finishing, skipping and Esc all count as seen. It comes back from the Tour button on the page and on Config → Glances, from the Play the Glances tour button in Config → Help → Glances, and from Config → Behavior → Privacy & sync → Onboarding (Config › Behavior and Monitoring).
Config → Glances
The top of the section is a bar with a button per host, Add a host and Remove this host…, and how that host is: Connected, Not answering, Connection off or No address yet. Below it, five tabs. Each panel carries a badge: This host for what belongs to the host chosen above, All hosts for what is shared.
| Tab | What lives there | Scope |
|---|---|---|
| Connection | Show Glances in the navigation · the Connection to Glances switch (the same one as on the page) · Name · Address · login · Test connection, Open the Glances page, Remove the login | This host |
| Page | Refresh while the page is open (1 s to 15 min) · Overview shows · Yellow and red per reading | All hosts |
Which disks count: a prefix to remove from every mount point (/rootfs, when Glances runs in a container) and mounts to hide, one per line. Docker storage, squashfs, tmpfs and the like are always hidden | This host | |
| Recording | Record the busiest by itself (off, 3 or 5) · Collected data: how many series, points and incidents are held and since when, Download as CSV, Delete collected data | This host |
| Notices | One tick per kind of notice (Notices) | This host |
| Advanced | Same machine as the Containers view, Use Glances for the CPU, memory and network in the Containers view (The Docker host) | This host |
| Reset Glances…: removes every host, the logins, the lines, every choice and everything recorded, and switches Glances off | All hosts |
Changes are saved as you make them, a moment after you stop; Saved. appears beside the bar. A change to the address or the login also tests the connection at once, so a wrong one is said so. Refresh while the page is open is how often an open page reads the host for the figures you see; how often the record is written is Record every, on the page.
Keys
| Key | Action |
|---|---|
Shift + G | Open the Glances page, from anywhere |
o p c d n i h a | Overview, Processes, Containers, Disks, Network, Insights, History, Alerts |
m | Hosts (with more than one host) |
[ / ] | The previous or next section |
, / . | On the graph under the pointer: a shorter or longer range |
r | Read the host now |
/ | Search the processes |
Esc | Close the side panel, then leave the view |
A legend along the foot of the page names them. The commands, behind ::
| Command | Does |
|---|---|
:glances | Opens the page; :glances processes (or any section) opens one section |
:glances host <name> | Looks at another host |
:glances record 10s | Sets how often the host is recorded |
:glances pause · :glances resume | Switches the connection off or on |
:glances track <name> · :glances untrack <name> | Records or stops recording the history of a container or process |
:glances incidents | Opens the incidents |
:glances config | Opens Config → Glances |
The ones that change something need the write token.
When something is wrong
| You see | Why, and what to do |
|---|---|
No Glances icon, and Shift + G does nothing | Glances is off. Switch Show Glances in the navigation on in Config → Glances |
| Fill in the address first. / Glances could not be reached at that address. | Nothing answers there. Check the address and the port (61208), and that glances -w runs |
| That address is not allowed here. | The address is on your own network. Switch on Allow localhost & private-network bookmarks in Config → Behavior |
| Glances 4 is needed; this server answers like version 3. | Update Glances on that machine |
| Glances refused that login. | The server has a password. Fill in the username and the password in Config → Glances |
| Not allowed: the write token is missing or wrong. | The setting, the command line or the recording asks for the write token, and this browser has none |
| The connection is off. Showing the last data, from … | The connection switch is off. The page and the record stay; switch it on again, on the page or in Config |
| No answer from Glances just now. Showing the last data, from … | The host stopped answering. The page keeps what it read last, and the record shows a gap |
| Too many requests, retrying | The host or a proxy in front of it limits requests. Lengthen Refresh while the page is open |
| A section is missing from the menu | The host does not run that Glances plugin; the menu lists only what it can answer |
| A graph says Not enough data for this range yet | The record has not reached that far back yet; it fills at the pace of Record every |
| Nothing to show on the Overview | Every block is switched off in Config → Glances → Page → Overview shows |
| No Hosts section, no Host menu | There is only one host |
| A process has no command line | It needs the write token, and a process can have ended since the list was read |