

Self-hosted guide: containers, bookmarks and health
Most people who self-host keep three things apart: a dashboard with links to their services, something that tells them when a service is down, and something to look at their Docker containers. nextDash does all three on one screen, and — more useful than that — it knows they are about the same services. The bookmark for Sonarr, the Sonarr container and the check that watches it are linked, so a problem shows up wherever you happen to look, and the fix is one key away.
This guide shows how the pieces fit together. Each part links to the chapter with every detail.
What it gives you
| Question | Where you see the answer |
|---|---|
| Is everything running? | The Containers view (Shift + Y): every container with a status glow, CPU, RAM, healthcheck, restarts and an orange ↑ for an update waiting (Containers) |
| How is a machine doing over time? | The Glances page (Shift + G): processor, memory, disks, processes and containers of a Glances 4 host, with a record of thirty days, graphs, incidents and a forecast for filling disks (Glances) |
| Can I actually reach it? | The bookmark of its web UI, set to Monitor: checked by the server, with uptime, response time and certificate (Checks & health) |
| Which link belongs to which container? | The bookmark mark on a container's row, in the colour of that bookmark's checks — and the cube after the bookmark's name in the Bookmarks view, in the container's state, with Runs in on its side panel (Containers › The list) |
| What went wrong, and when? | The container's Timeline (crashes with exit code, out-of-memory kills, health changes, updates, rollbacks) and the bookmark's Health in large (every check, every outage) |
| Will I hear about it? | One set of alert channels and push notifications for sites going down, certificates running out and containers stopping, restarting, turning unhealthy or running hot (Checks & health › Alerts, Containers › Notices) |
| Is it up to date? | Image update checks with release notes, skip and hold, a history, a rollback, and optional nightly updates that roll themselves back on failure (Containers › Actions and updates) |
| Where did my disk go? | The Disk tab: images, volumes, build cache and bind mounts, biggest first, with clean-ups that say what they free (Containers › Disk) |
| How is the machine? | The Processor, Memory, Disks, Containers and Container list widgets on the dashboard (Widgets › System widgets and what they need) — and, for your other machines, the four Beszel widgets (Widgets › The kinds) and the Glances widget |
The difference with separate tools is in the links between those rows. A container that keeps restarting is a red glow in the Containers view, a problem on its Container list row, a notice on your phone — and, because its web UI stops answering, a red mark on its bookmark, an outage in that bookmark's history and a downtime alert. Each place leads to the others with a click.
Set it up in four steps
nextDash runs fine without any of this; the steps below add the self-hosting half. Containers › What it needs has every detail, including Unraid, Synology and QNAP.
- Give it the Docker socket. Mount
/var/run/docker.sockand setNEXTDASH_DOCKER_SOCKET=/var/run/docker.sock. The Containers view, the Containers widgets and the header icon appear. Read-only (:ro) is enough to look. - Decide whether it may act.
NEXTDASH_DOCKER_CONTROL=1allows start, stop, pause, restart, update, remove, rollback, automatic updates and Disk clean-ups. Without it the view only reads — a sensible first week. - Set a write token.
NEXTDASH_WRITE_TOKENwith a long random string (openssl rand -hex 32). Access to the Docker socket is root on the host, so other websites and scripts must not be able to send requests in your name. - Put a gate in front. The token is not a login: the dashboard hands it to every browser that opens the page. Keep nextDash behind Tailscale or a reverse proxy with authentication (Security and self-hosting) — with actions on, anyone who can open the dashboard can stop your containers.
services:
  nextdash:
    image: ghcr.io/jordibrouwer/nextdash:latest
    ports:
      - "8080:8080"
    volumes:
      - ./data:/app/data
      - /var/run/docker.sock:/var/run/docker.sock:ro
      - /mnt:/host/root/mnt:ro,rslave              # for the Disks widget
    environment:
      - NEXTDASH_DOCKER_SOCKET=/var/run/docker.sock
      - NEXTDASH_DOCKER_CONTROL=1
      - NEXTDASH_WRITE_TOKEN=change-me-to-a-long-random-string
      - NEXTDASH_HOST_ROOT=/host/root
      # - NEXTDASH_RUN_AS_ROOT=1                   # only if the log says "owned by gid 0"
    restart: unless-stopped
Then open Config → Containers. Connection shows what the server sees — socket, actions, write token, its own container. Fill in Docker host address (the server's LAN address or name, such as 192.168.1.10 or tower.local) so port links open on the server rather than on the machine you are browsing from, and switch Check for image updates to every 6, 12 or 24 hours.
Link each web UI to a bookmark
No bookmarks for your services yet? With the socket mounted, nextDash offers them itself: a card lists the containers that answer with a web page, and Add puts them on the page, each with an icon, a status check and the link to its container already made (Containers › Apps it finds on its own).
You probably have bookmarks for your services already. nextDash finds the one that belongs to each container on its own, in this order, and stops at the first step that finds exactly one:
- the bookmark you chose in the container's side panel, under Bookmark;
- a bookmark on the same port of this server —
http://192.168.1.10:8989for a container publishing 8989; - a bookmark whose subdomain is the container's name —
sonarr.example.com, as a reverse proxy gives it; - a bookmark titled after the container.
Once linked, the container's row shows a small bookmark mark: green when its checks pass, red when it is broken or down, an outline when nothing checks it. A click opens the bookmark in the Bookmarks view. The other way round, the bookmark's row in the Bookmarks view carries a cube in the container's state (The Bookmarks view › The toolbar and the list), and its side panel shows Details → Address → Runs in, a link to the container.
The links, and what comes out of them:
When the guess is wrong — two bookmarks on one port, a service behind a path rather than a subdomain — choose the bookmark by hand under the container's Bookmark → Linked bookmark, or No bookmark. A container without a bookmark at all is a hint: add one, so it shows on your dashboard and can be monitored.
When the web UI is somewhere else — behind your reverse proxy, on another port — set it in the side panel's Custom → Web UI address. [IP] stands for this server. The list, the Container list widget, search and :docker <name> open all use it.
Monitor it
A running container is not the same as a working service. A container can be up while its web UI shows an error page, its database is gone or its certificate has expired. The bookmark checks the service the way you use it — from the outside.
- Open the bookmark (from the container's row, or the Bookmarks view) and set its availability to Monitor —
Shift + Con the dashboard,cin the Bookmarks view. - Choose how often: 5 minutes to 24 hours, 15 minutes by default.
- For a service that answers 200 while it is broken, open Expected response and give it a phrase that only shows when it works, or the status codes that count as healthy.
- For a service behind a sign-in, give it an Address to check instead — a
/healthor/api/statusendpoint — and, if needed, a stored sign-in from a Custom widget. - A self-signed certificate on your LAN? Tick Accept a certificate this machine does not trust.
Local addresses are checked once Allow local bookmarks is on (Security and self-hosting › Local addresses and outgoing requests). Planned downtime — the nightly backup that stops a database — goes in a maintenance window (Checks & health › Maintenance windows), so it opens no incident and sends no alert.
Collection health shows uptime and certificates for every monitor at once; the Uptime, Certificates and Domains widgets put the same on a dashboard page.
Get told: alerts, push and notices
There is one place where bad news goes, and both halves use it.
Where it goes. Set it up once under Monitoring → Notifications:
- Downtime alerts — Slack, Discord, Telegram, Gotify, ntfy, Pushover, Apprise (which passes an alert on to mail, Matrix, Signal and more — Checks & health › Alerts) or your own JSON receiver. Send test alert proves the route. ntfy alerts carry Open link and Health buttons, and failures go out at a higher priority than recoveries.
- Browser notifications — push to your phone, tablet or desktop, even with nextDash closed. Press Enable on this device on each device. On iPhone and iPad, add nextDash to the home screen first, and serve it over HTTPS (Phones, tablets and the installed app).
What arrives there:
| From | Message |
|---|---|
| A monitored bookmark | Down, after the failures in a row you chose (3 by default), and up again with how long it was down |
| A certificate | 30, 7 and 3 days before it expires |
| A container | Stopped unexpectedly, keeps restarting (three crashes in ten minutes), turned unhealthy — and recovered |
| A container running hot | Above the CPU or memory line for longer than you allow (90 % for 10 minutes until you change it), and back under it |
| An automatic update | Done, rolled back and why, or not possible |
For containers on your phone, also switch on Notify when a container stops, keeps restarting or turns unhealthy under the browser notifications.
Keeping it quiet. nextDash leaves out what you did yourself: a stop you asked for is not a notice, nor is a crash the restart policy fixes within 30 seconds. One incident is one notice; four or more at once become one message, and a host that takes many bookmarks down together sends one downtime alert. Mute what you do not care about — a container with m or its row menu, a bookmark with Do not alert me about this bookmark — and it still shows its state on screen. Config → Containers → Muted containers says where container notices go, and Hidden containers keeps test containers out of the view and the widget count altogether. To hold notices overnight, or to be reminded of an outage that goes on, use Quiet hours and Reminders (Checks & health › Maintenance windows). Once a week the Weekly digest sums it all up — what broke, what can be updated, what nobody opens (Checks & health).
For other programs. Outgoing webhooks send health.down, health.up, health.cert-expiring and health.domain-expiring, signed, to anything that listens — Home Assistant, n8n, a script (Data, backups and import › Webhooks).
Keep it current
With Check for image updates on, nextDash asks each image's registry for a newer version on the interval you chose. A container with one waiting gets an orange ↑, the header icon a count, and the Updates filter lists them all. The side panel's What's new tab shows the release notes behind the update before you take it.
- Update one —
uon the row, or:docker sonarr update. Update and remove always ask first. - Update a stack — Group by project, then Update (n) on the compose project's row.
- Update a selection — tick rows with
x, then Update in the bar. - Skip this version — when a release is known to be bad. A newer one counts again.
- Hold updates — for a container you pin on purpose, such as a database.
- Roll back — while the old image is still on the host, Roll back to … puts the container back on it, without a download, and skips the version it leaves.
Update automatically lets nextDash do it for you, in a nightly window (03:00 to 05:00 until you change it). Each container is updated one at a time and then watched for five minutes. If it stops, starts again on its own or turns unhealthy, it is rolled back to the image it had and that version is skipped — and you get a notice either way. Good candidates are stateless apps with a healthcheck; keep databases and anything with a migration on Hold and update those by hand.
Because the bookmark is monitored too, an update that leaves the container running but breaks the web UI still raises a downtime alert in the morning.
Keep it tidy
- Disk (
din the Containers view) shows what images, volumes and the build cache take up, and what can be reclaimed. Clear unused or dangling images, the build cache and stopped containers in bulk; volumes go one at a time, after typing delete. A dangling image that is still a container's way back says rollback for … before you remove it. On Unraid, Bind mounts lists the appdata folders each container uses, with Measure to size one. - The logs window (
l, or:docker <name> logsfrom anywhere) follows a container's log live, with search, a filter, stdout and stderr apart, and download. - The timeline keeps thirty days of what happened to each container — useful after a night of automatic updates, or when a container seemed fine.
- The Containers widget can show reclaimable space, so a filling disk shows up on the dashboard before it becomes a problem.
Unraid
nextDash reads an Unraid server through its own API — Unraid 7.2, or an older Unraid with the Unraid Connect plugin. Set it up once under Config → Unraid: the address, an API key with the role Viewer (Settings → Management Access → API Keys in Unraid), and a test. From then on:
- Seven widgets show the server on a page: an overview, the array with every disk, parity, shares by where they live, VMs, the UPS and Unraid's notifications (Widgets › Unraid widgets).
- Alerts reach you through the channels downtime and container alerts use: Unraid's own ALERT notifications, the array stopping, a parity check that finished with errors, a disk whose error count went up.
- Read only. nextDash never starts, stops or changes anything on the server.
More is on the way: further Unraid integration is being worked on for future versions of nextDash.
A homelab page
Give your services their own page — Homelab, Server — and put the bookmarks for every web UI on it, grouped the way you think of them: Media, Network, Home, Tools. Then add widgets beside them (Widgets):
| Widget | Why on this page |
|---|---|
| Containers | Running and total, failing healthchecks, restarts, updates waiting, reclaimable space, incidents in 24 hours, the three busiest |
| Container list | Every container on its own row, problems first; a click opens it in the Containers view or goes straight to its web UI |
| Uptime | The monitored bookmarks on this page, worst first, with a heartbeat |
| Certificates | The ones that run out soon |
| Domains | The domain names that run out soon, by registered domain |
| Health | Broken, down and changed bookmarks on this page; each figure opens its filter |
| Processor, Memory, Disks | The machine itself — name /mnt/user and /mnt/cache on Unraid |
| Beszel systems, Beszel attention | Your other machines, through a Beszel hub: whether each is up and how busy and full it is, or only the ones that need a look |
| Custom | Figures from the services themselves — the queue in Sonarr, blocked queries in Pi-hole, a sensor in Home Assistant, CPU and memory in Proxmox — 41 services filled in (Widgets › The Custom widget) |
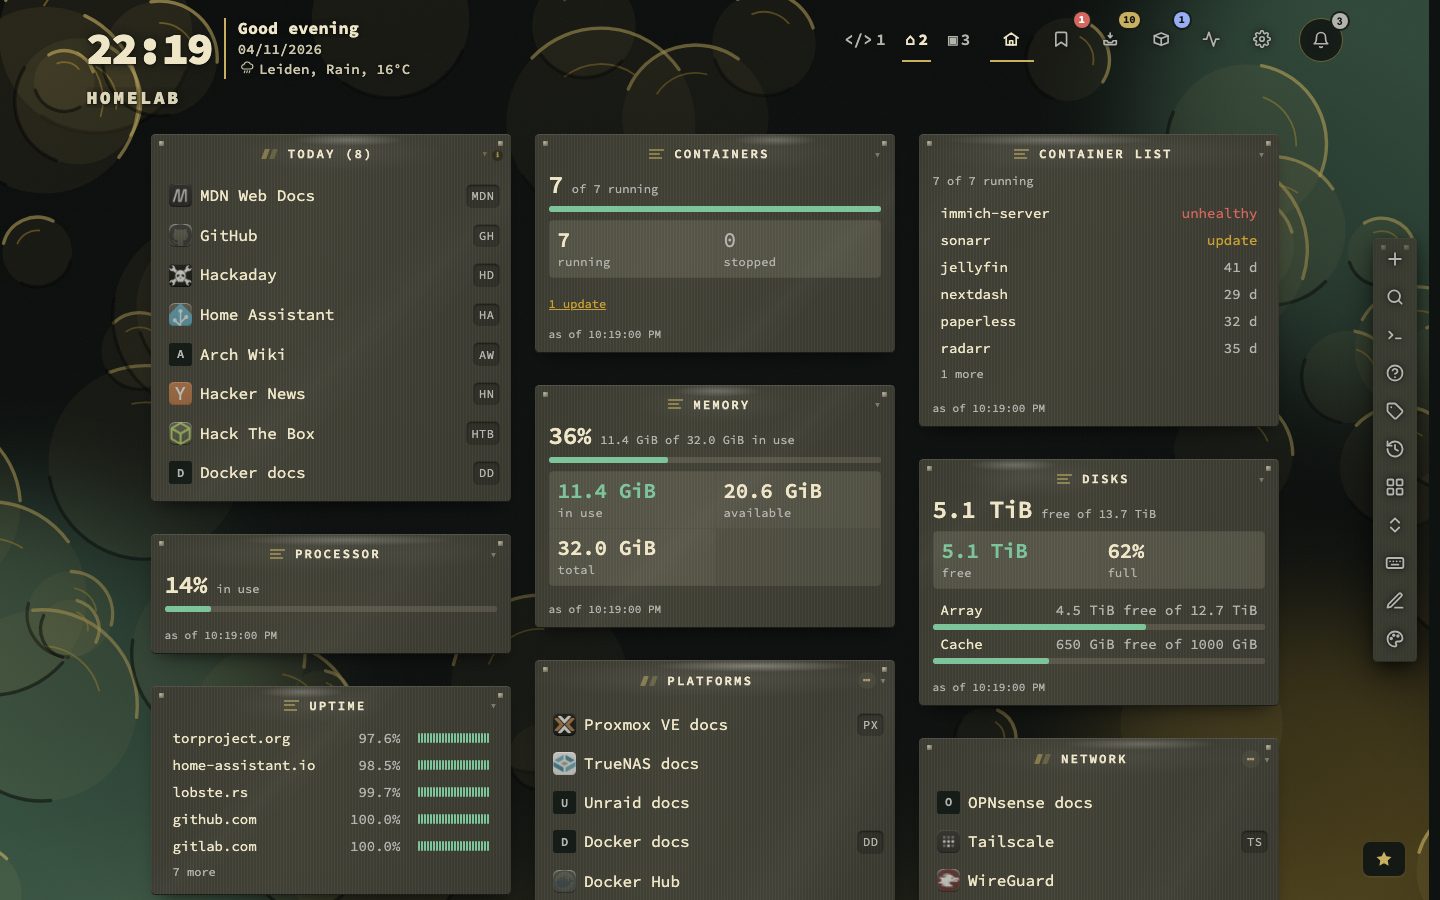
Set a widget to two columns and it says more, not the same thing larger: the container failing by name, the expiry date of a certificate, the load behind the processor's percentage.
A morning routine
What a check of your setup can look like, all from the keyboard:
- Open the homelab page. The Containers widget says 0 incidents, Uptime is green, nothing waits in Certificates.
- Or not: a notice on your phone said the automatic update of Paperless was rolled back at 04:09, and its bookmark sent a downtime alert and a recovery around the same time.
Shift + Yopens the Containers view; Paperless runs again, on its old image. Enteropens its side panel. The Timeline shows the update at 04:05, the crashes after it and the rollback. Updates → History names both versions.lopens the logs window; search forerrorto see why the new version failed.- The version stays skipped until a newer one arrives. Hold updates if you would rather wait for a fix before nextDash tries again.
- Click its bookmark mark: the bookmark's Health tab shows the minutes of downtime that matched the crashes.
dfor Disk: the new image that failed is still on the host, used by nothing. Clear Unused images once you are sure — a later update downloads what it needs.- Elsewhere, an orange ↑:
#docker?filter=updates, read What's new for each, and update what you trust.
Keys and commands for daily use
| Key or command | Does |
|---|---|
| Shift + Y | Open the Containers view |
| Shift + G | Open the Glances page |
:docker <name> | Find a container from anywhere; add open, logs, start, stop, restart, pause, update or remove |
| s · r · p · u | Start or stop, restart, pause, update the selected container |
| l · m · d | Logs window, mute notices, Disk |
| x · Shift + X · Ctrl/Cmd + A | Tick one, a run, everything the filter shows |
| / | Search the containers |
| Shift + C | Change a bookmark's availability (Off, Periodic, Monitor) on the dashboard |
#docker?filter=updates | The containers with an update waiting |
#bookmarks?health=monitored | Every monitored bookmark, with its uptime |
The full list is in Containers › Keys and on !.