Network tests
Newsince v1.28 · 10 Nov
Test a bookmark’s own host: the port, a ping, DNS records, the certificate, an HTTP answer, a value in JSON. Once, or on a schedule.
Until now nextDash could tell you whether a page loads. It could not tell you why a service was slow, whether its certificate was about to run out, or whether somebody had changed its DNS. A bookmark now carries network tests: is the port open, does the host answer a ping, what do its DNS records say, how long is its certificate good for, what does it answer to an HTTP request, what is the value in its JSON answer. Run one test right now, or put it on a schedule with a history and alerts.
Try it
- Open the Bookmarks view (Shift + B) and click a bookmark. Its side panel opens.
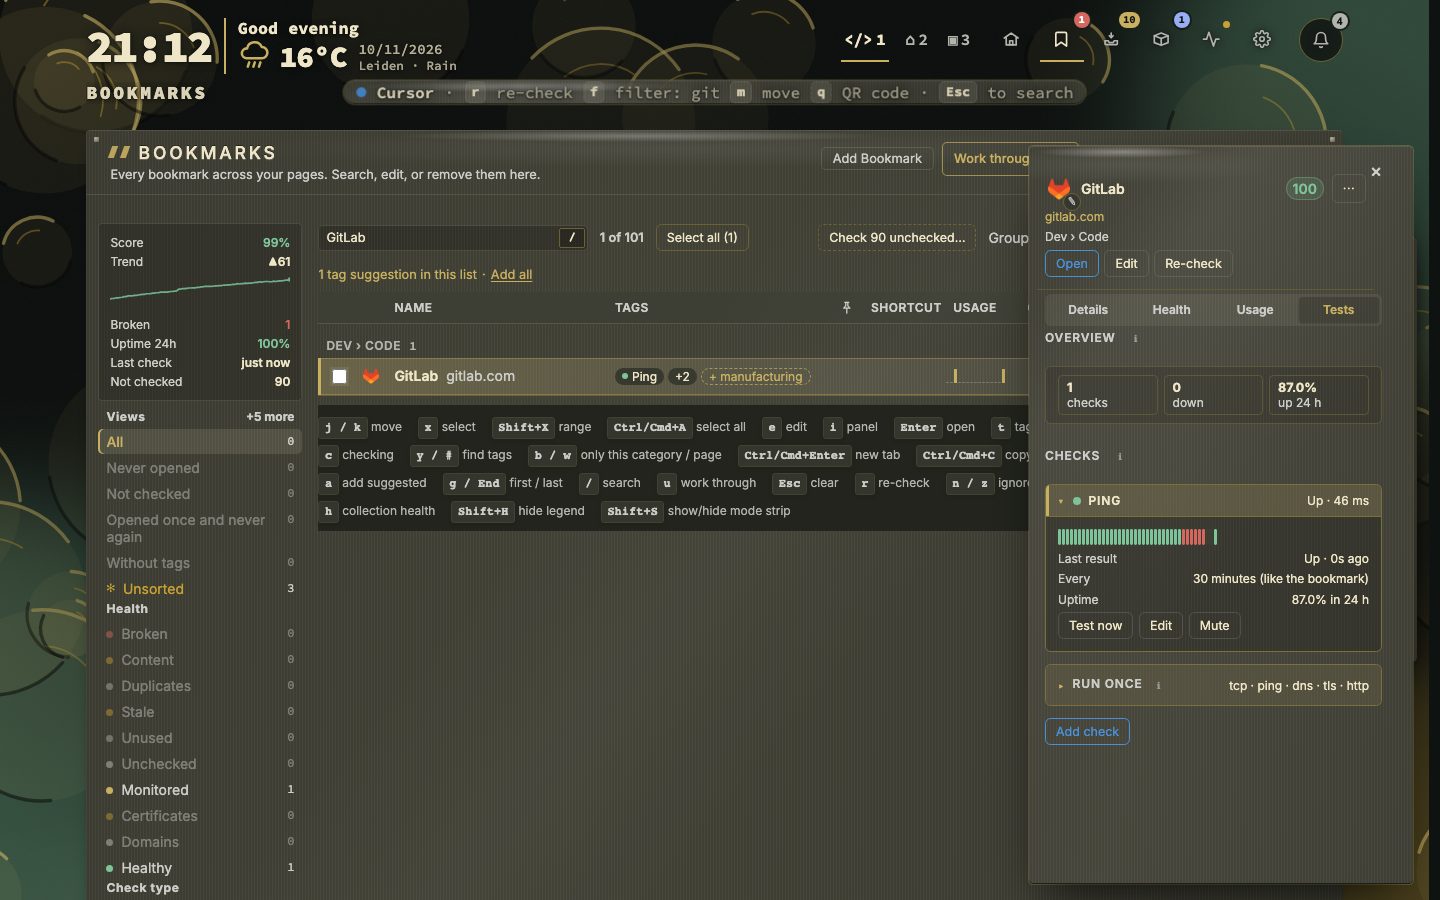
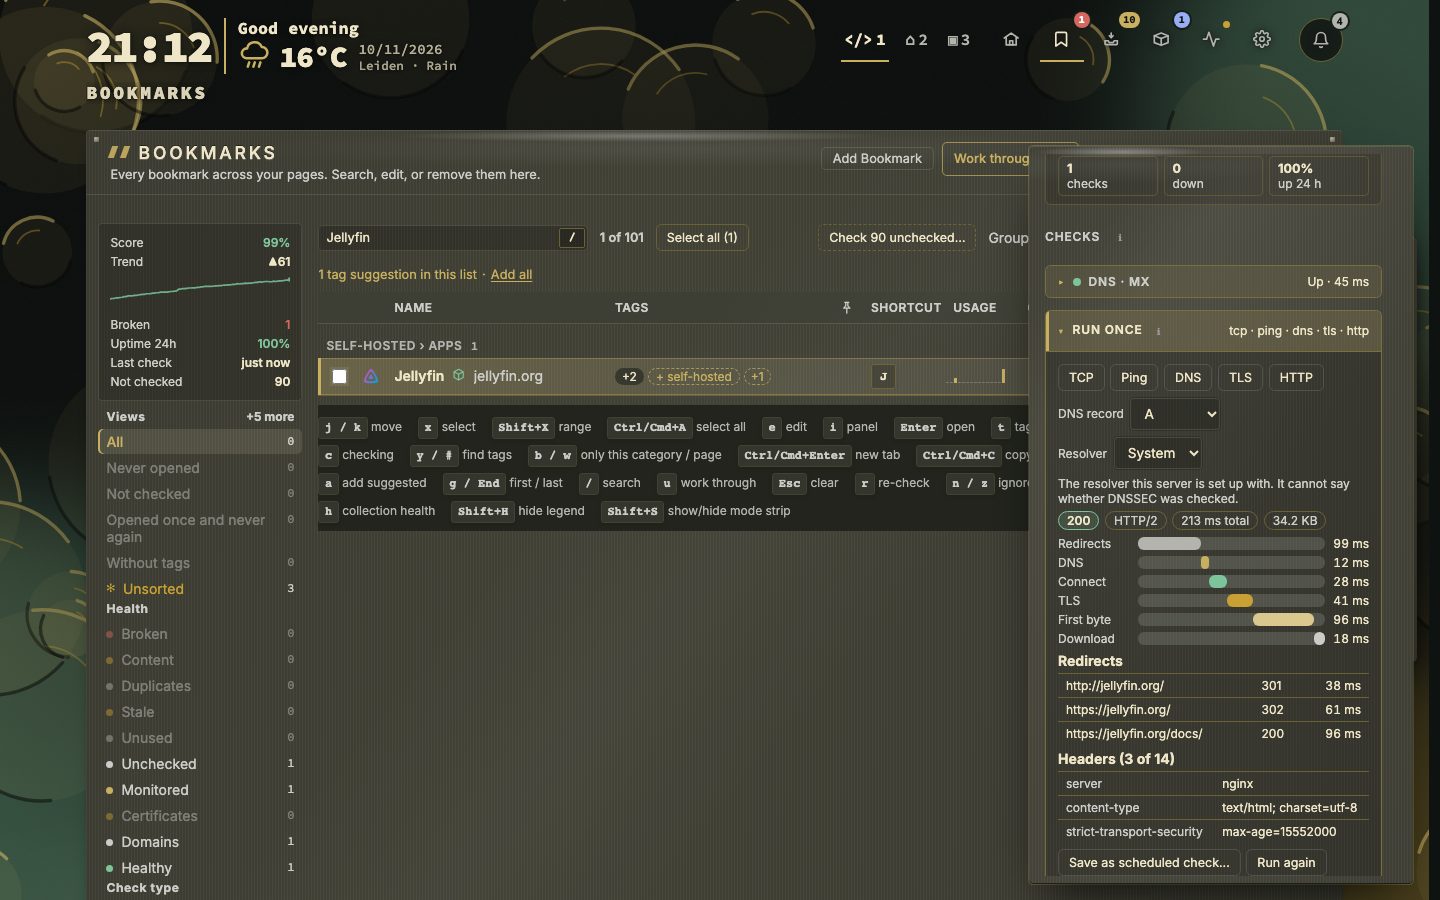
- Press 4 for the Tests tab. Open Run once, pick TCP or HTTP and read the answer. Nothing is saved.
- Press Save as scheduled check… to keep what you just tested, or Add check to build one in three steps: the type, what to check, then planning and alerts.
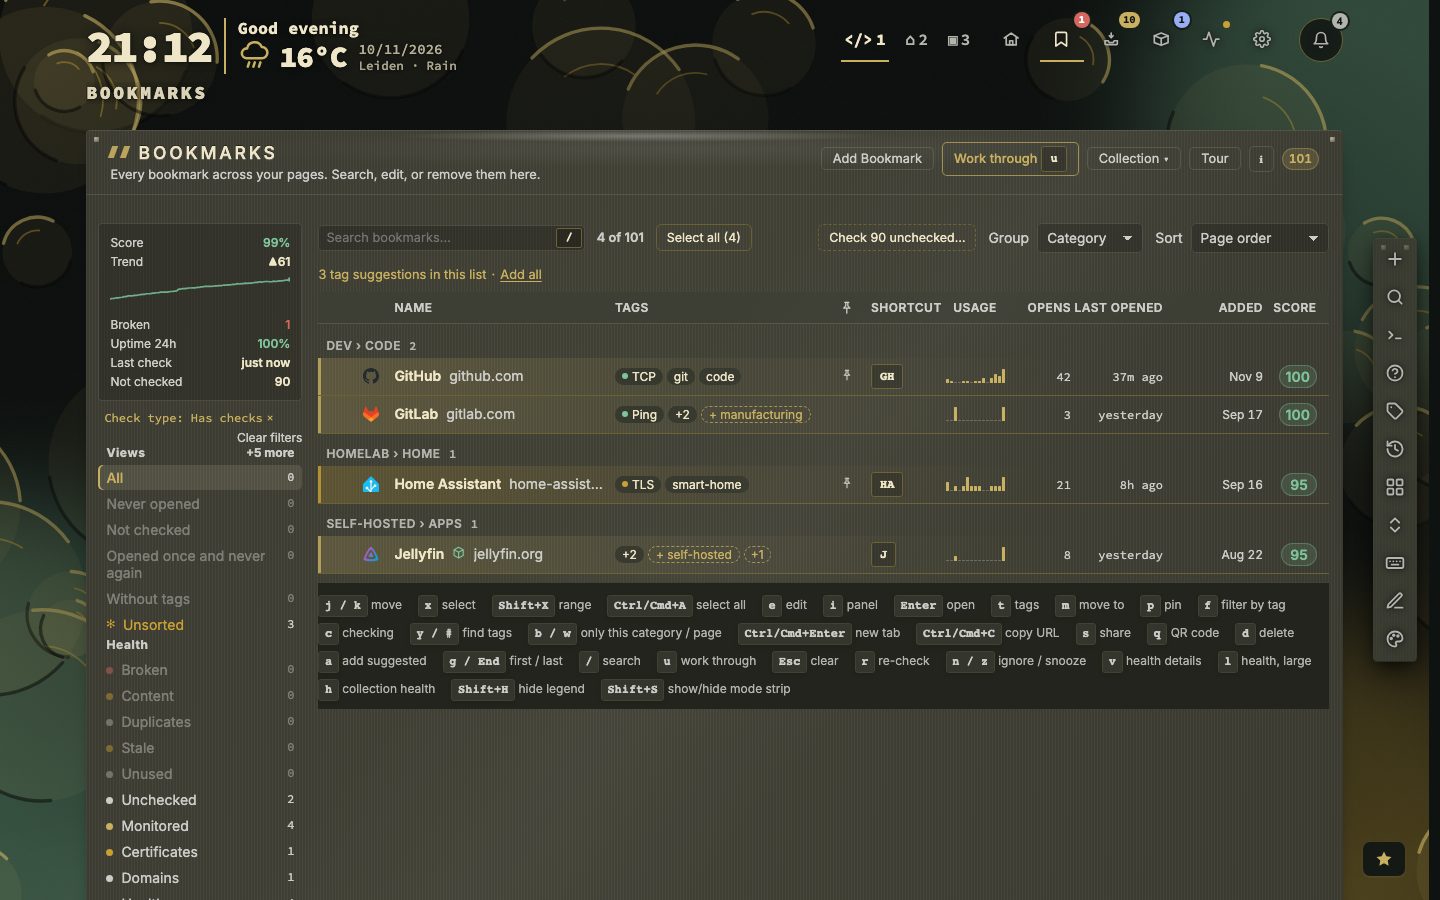
- Look at the row in the list: the check is a small chip beside the tags, with a dot for its state.
Six kinds of check
- TCP: does the port accept a connection, and how fast.
- Ping: one to ten echoes, and how many are lost. Where a container may not send a ping, the check connects over TCP and says via TCP.
- DNS: one record type of the host (A, AAAA, CNAME, MX, TXT, NS or CAA), with an optional expected value. When the records change, the bell says so and Accept makes the new answer the one to compare with.
- TLS: the certificate a port presents, its chain, the version and the days left. A certificate close to expiry is a Warning with notices on a ladder, not an outage.
- HTTP detail: one request with its timeline (DNS, connect, TLS, first byte, download), the redirect chain and the headers.
- JSON: one value in a JSON answer, read by a path such as
services[name=api].up, compared with is equal to, is more than, contains or exists.
Where the checks show up
A scheduled check is not hidden in a tab. It is a chip beside the tags of its row, problems first, with the rest folded behind a +n. A check that fails, or came back within a day, is a row in the notifications bell with Health and Mute. The Network tests widget puts chosen checks on the dashboard as rows, tiles or a heartbeat strip of the last day, and a service on the status page can list the checks of its bookmark. In the Bookmarks view, the Check type filter in the rail lists the bookmarks that have one.
A short leash
Network tests send real traffic from your server, so they stay narrow. A check always aims at the host of its own bookmark: there is no free host field, no traceroute and no port scan. Every connection goes through the same address guard as previews and favicons, so a private address is refused unless you allow local addresses, and the refusal reads Not measured, not an outage. At most six one-off tests a minute, one test per host at a time, and a ceiling on the scheduled checks of the whole install. A sign-in stored on the bookmark goes only to that bookmark and never into a result, a sample or the activity log. The demo runs no test.
Settings and MCP
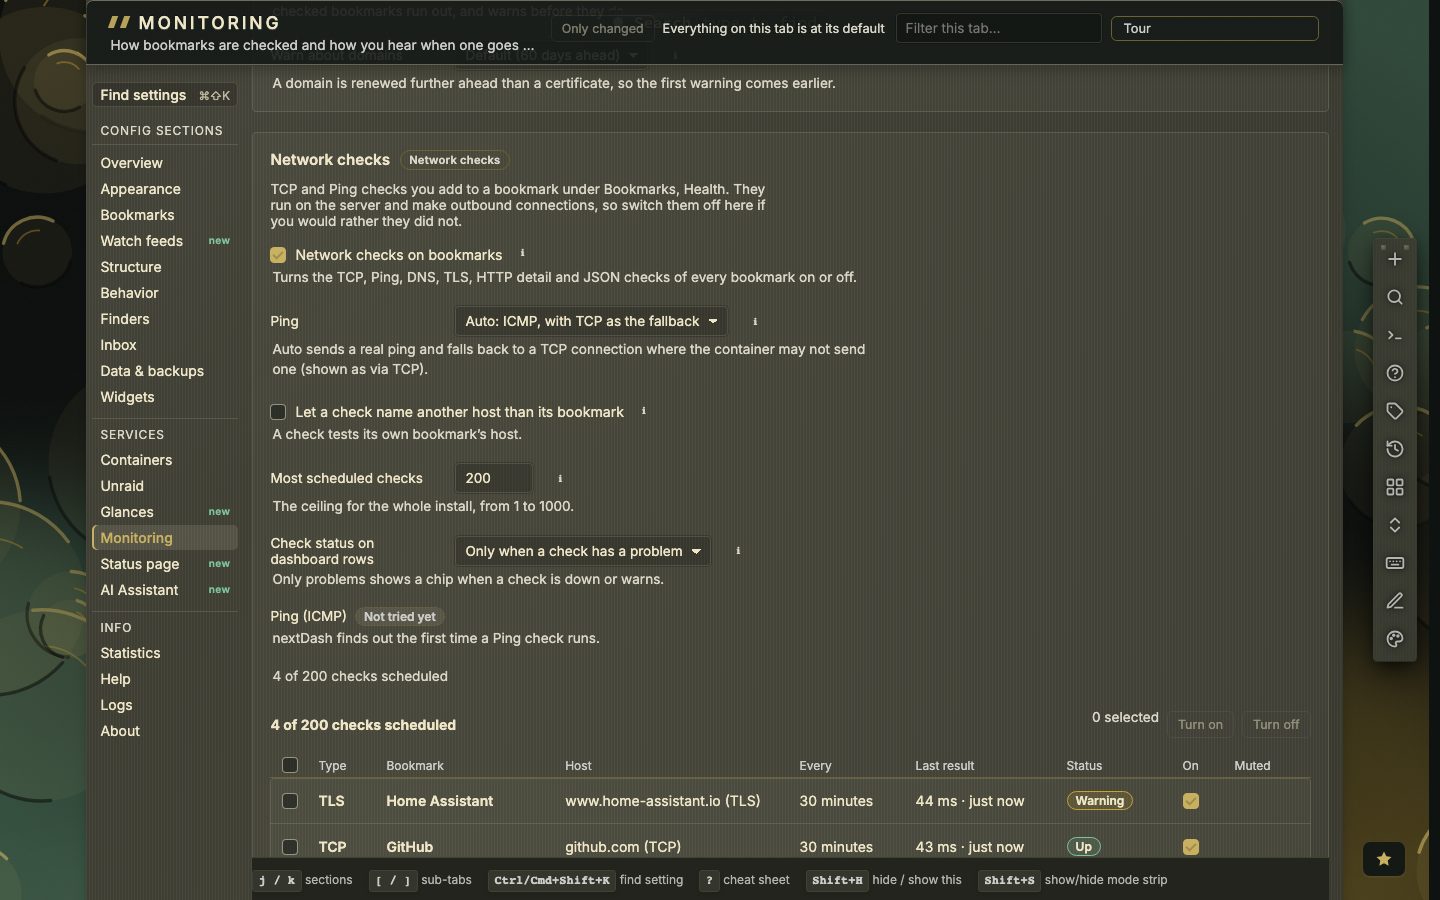
Config → Monitoring → Checks holds the master switch, the Ping mode (Auto: ICMP, with TCP as the fallback, TCP only or Off), the ceiling, how the chips show on the dashboard rows, and a table of every check in the install, where you can turn several on or off at once. In Docker, a real ping needs one line in the compose file; the panel shows it. Five tools let an MCP client run a test, list, read, add or delete checks, behind a switch of their own that is off until you turn it on.
Elsewhere
Alerts for a failing check use the same quiet hours, retries and maintenance windows as the rest of your monitoring: see Alerts and Collection health. The full description is in the docs, in the chapter on checks and health.