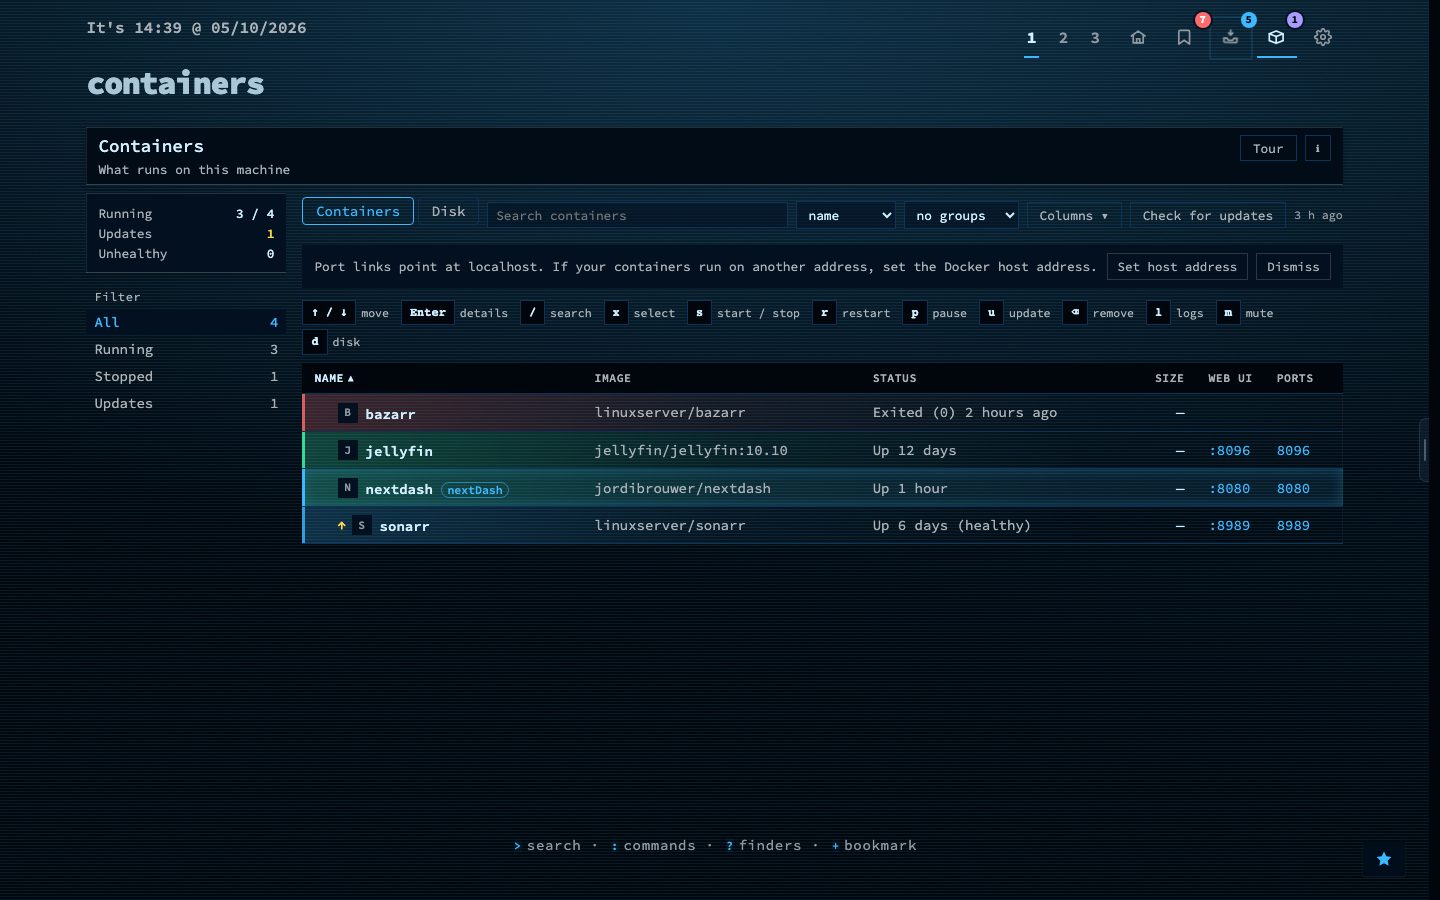
If you run nextDash next to your containers, the Containers view shows them in a table you can sort, group and trim. Choose columns for CPU, RAM, size and restarts, and group by project, status, network or image.
Each container has a timeline in its side panel: started, crashed with an exit code, turned unhealthy, updated, rolled back. The panel also shows the last five healthcheck results. nextDash follows the Docker event stream instead of polling, so a crash that the restart policy fixes within seconds still sends you a notice.
Try it
- Press Shift + Y on the dashboard.
- Click a column heading to sort, or pick a grouping.
- Open a container and press l for its live logs.