Glances
Recentsince v1.21 · 23 Oct
One machine as Glances sees it, with a record of thirty days.
- ShiftG Open Glances
- o Overview
- p Processes
- h History
- m Hosts
Glances is a small server that reports one machine: its processor, memory, disks, processes and containers. nextDash reads it and gives it a page of its own, with a record that goes back thirty days, graphs, incidents and a forecast for disks that are filling up. nextDash only reads. It does not install Glances and it changes nothing on the machine.
Try it
- Run Glances 4 in web mode on the machine you want to watch. The Glances container serves on port 61208.
- Open Config, then Glances, and fill in its address. Test connection says what answered, or why nothing did.
- A Glances icon appears in the header, before Config. Click it, or press Shift + G.
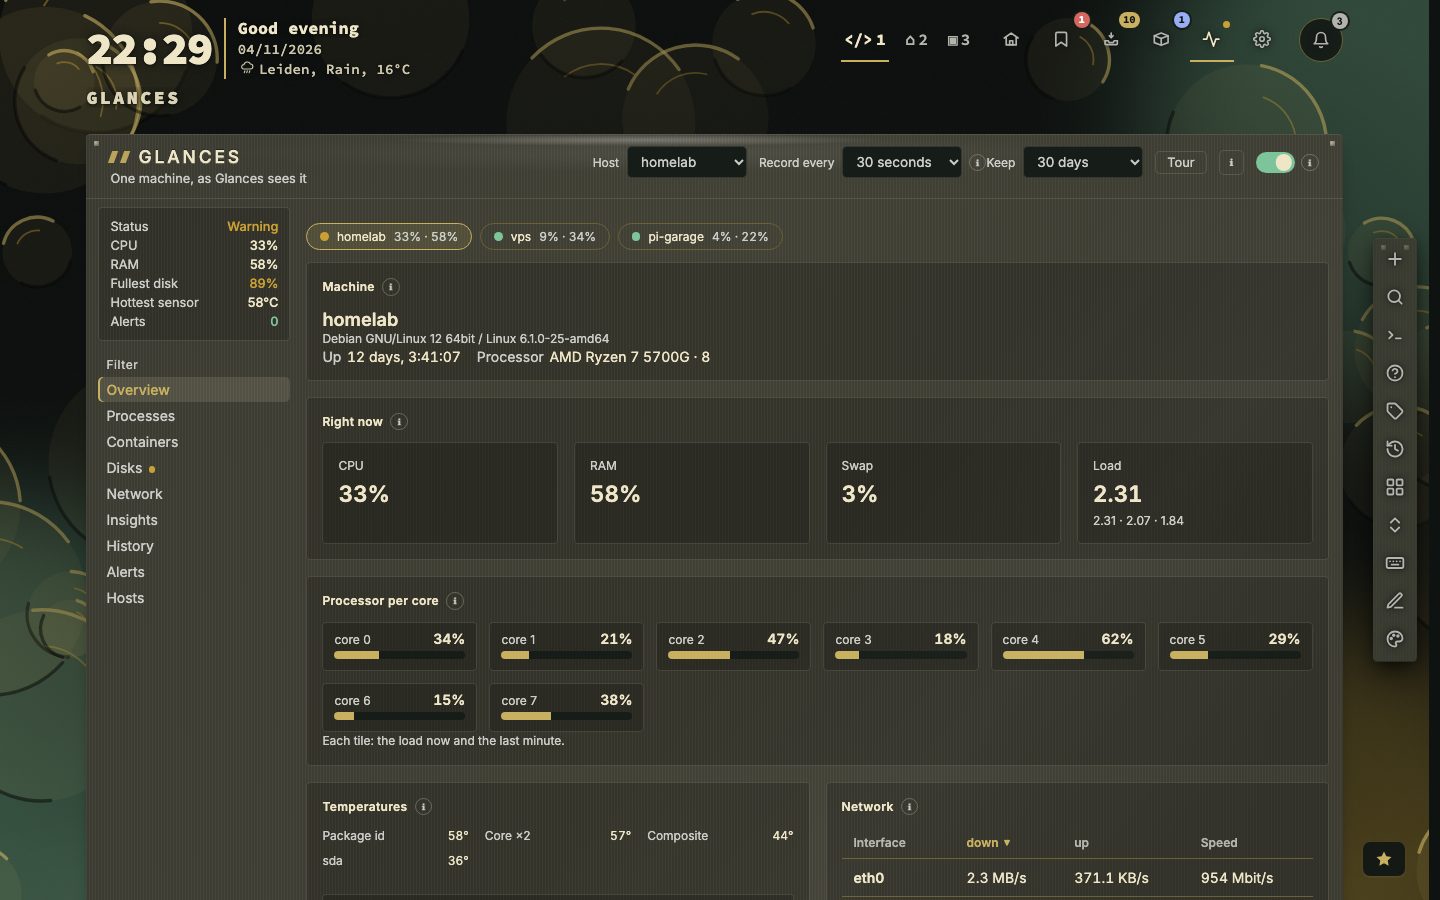
A record of its own
nextDash reads the host every thirty seconds, or as often as you choose from two seconds to an hour, and keeps thirty days. History draws a graph for the processor, memory, load, network, disk activity, disk use and temperatures, each with its own range. Lay yesterday or last week behind today as a dashed line, or save a graph as an image.
A reading that stays past its red line for a few readings in a row is an incident, drawn as a red band on the graphs. Click the band and a side panel shows the moment from before to after it, and who was busiest.
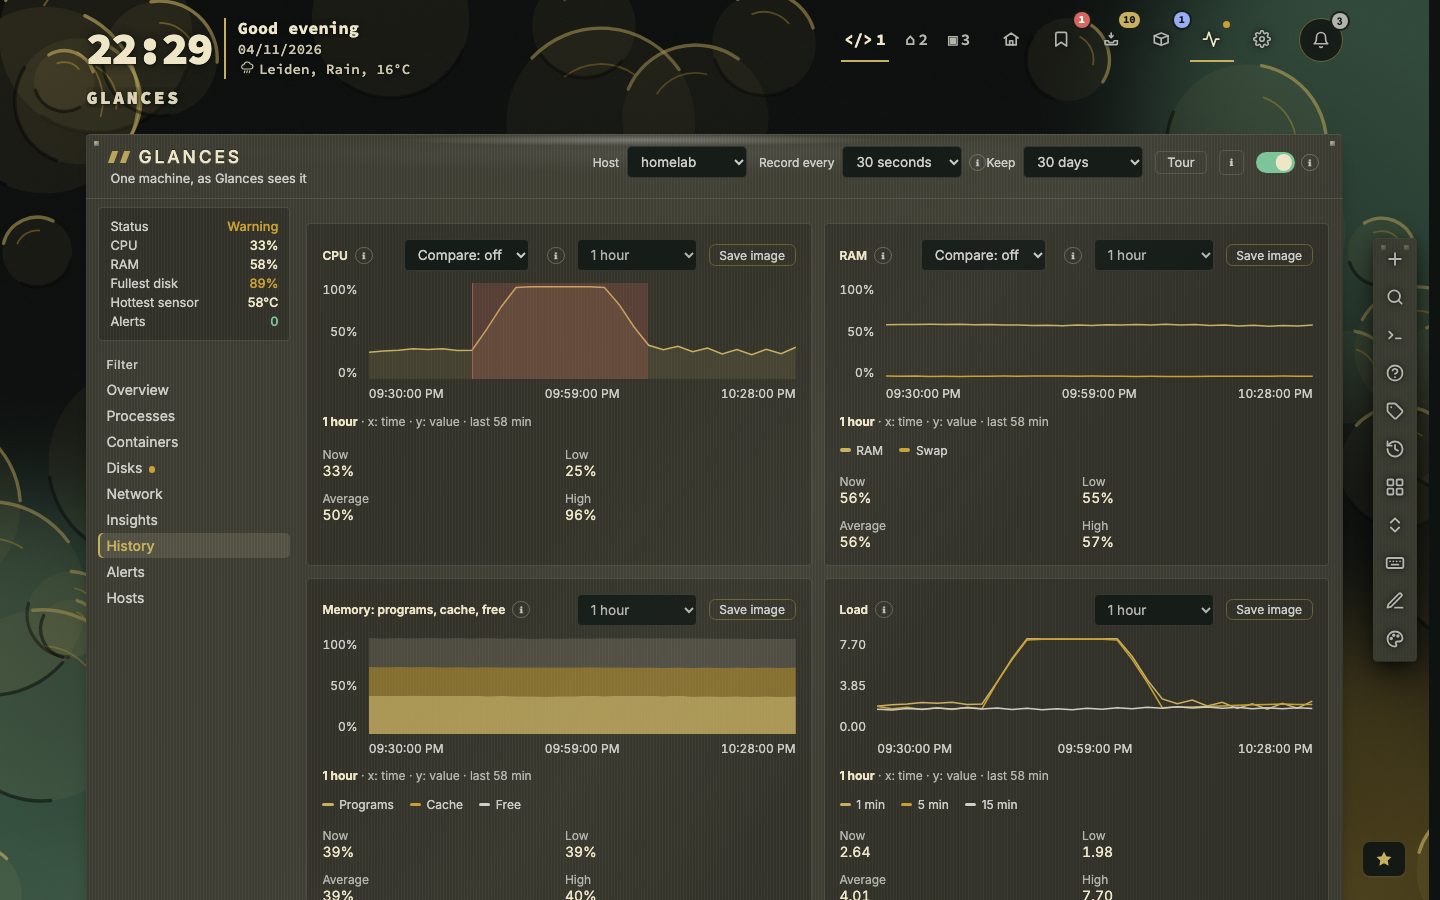
Processes and containers
Processes lists everything that runs, with search and sort. A row opens a side panel with its details and, once you switch recording on, its history. The same goes for containers. The command line of a process is read only when you ask, and behind the write token, since it can hold a secret.
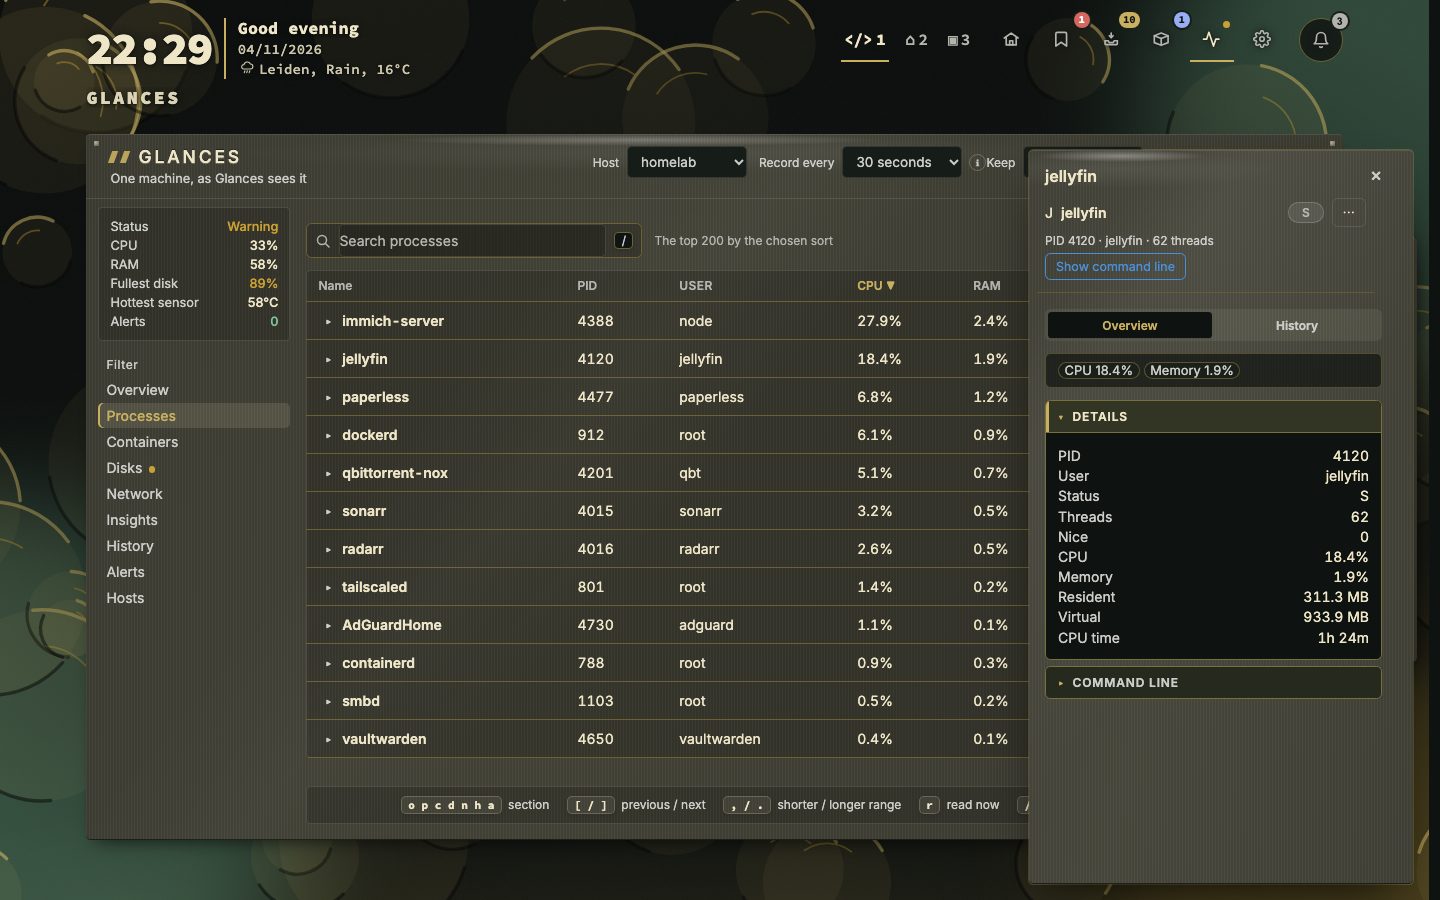
More than one machine
nextDash watches up to five hosts. Each has its own address, record, incidents and notices. A Host menu picks the one on the page, and a Hosts section lists every host in one table from the record, so it costs the hosts nothing.
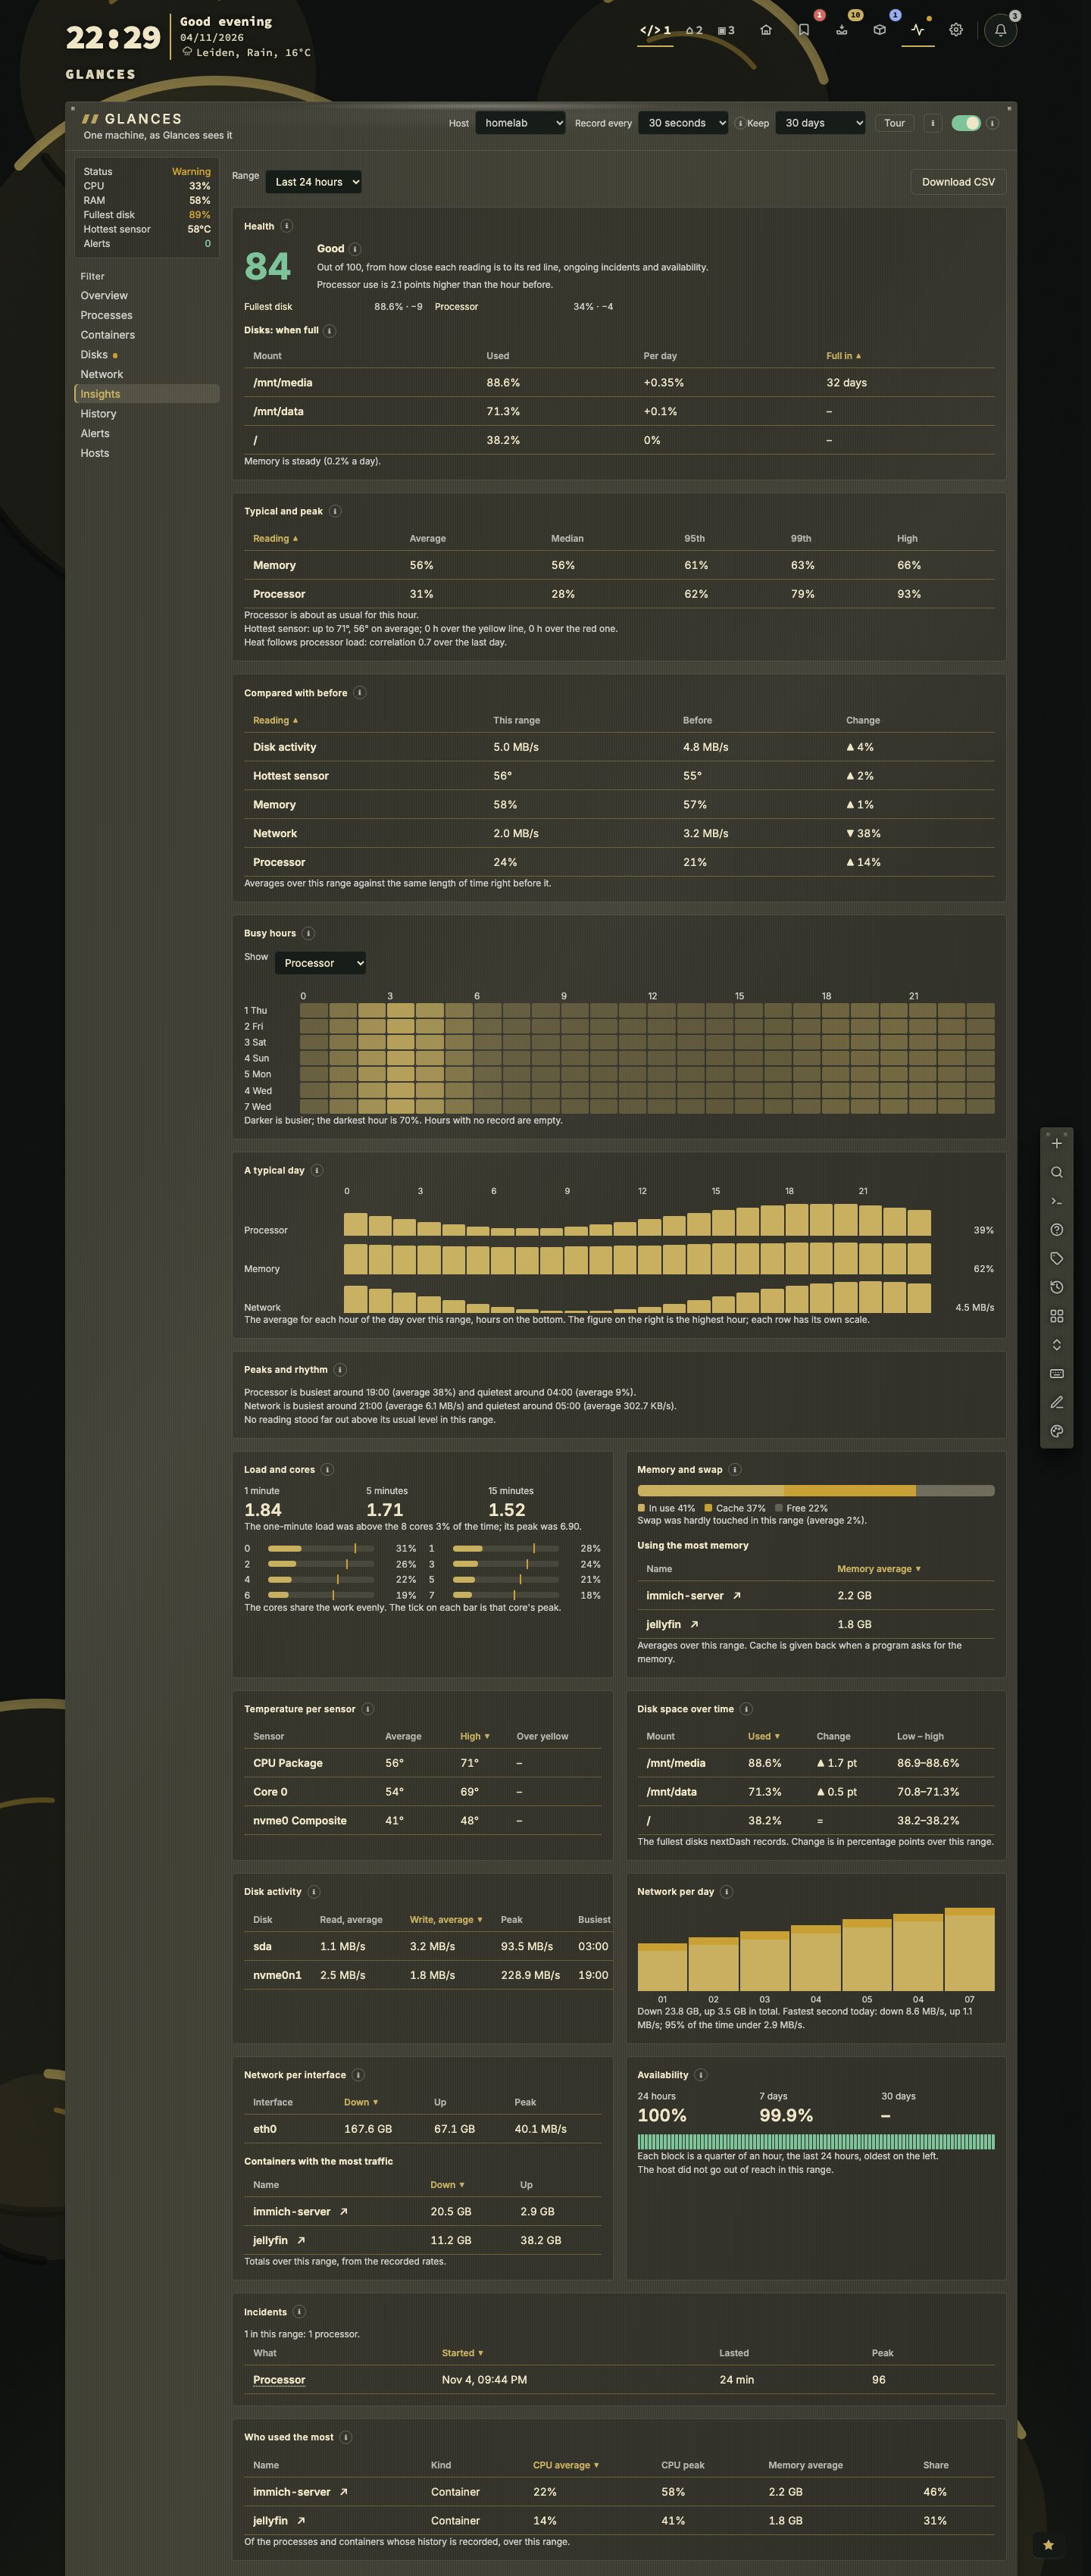
Insights
Insights answers questions from the record, over the last 24 hours, 7 days or 30 days. A health score out of 100 says how close each reading came to its red line. A line through the last week of each disk says when it is full. Under it: typical and peak figures, this range set against the one before it, the busy hours of each day, and a typical day with a bar for every hour.
It also shows where the load goes: the load against the number of cores and how evenly the cores share the work, where the memory goes and how long the swap was in use, every temperature sensor, how full each disk got, what each disk and network interface carried, and who used the most. An i beside every title says in a few sentences what the block shows. A block with too little behind it is left out.
On the dashboard
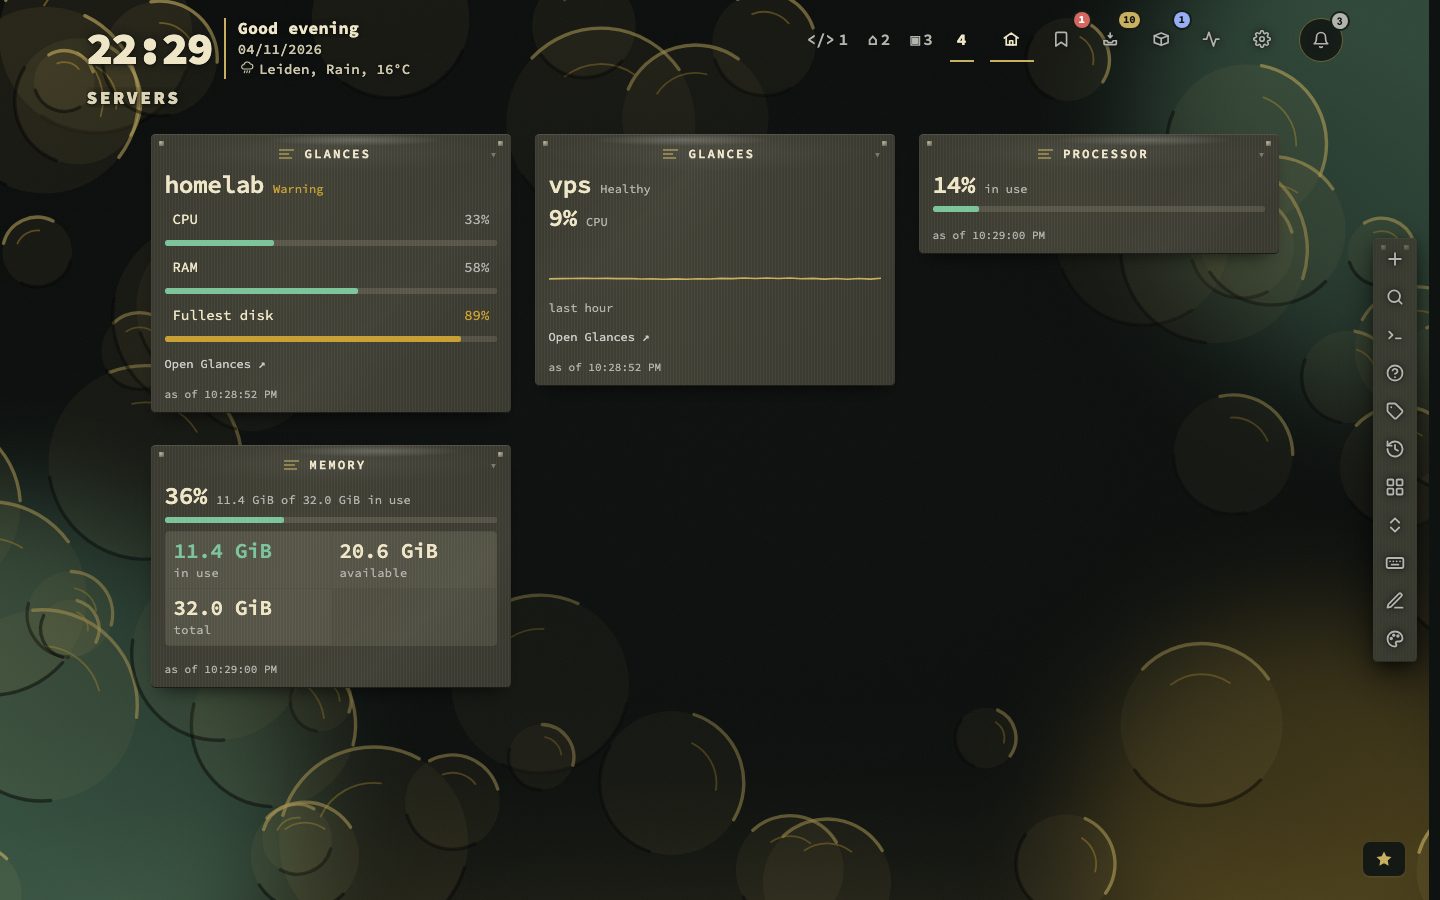
The Glances widget puts one host on a page of your dashboard, as three meters or as the processor’s last hour, and says since when a host does not answer rather than printing old figures. When a Glances host runs on the same machine as nextDash, the Containers view and the Glances page link to each other, and the Containers view can read processor, memory and network from Glances.
Notices
A notice goes out when a disk is filling up or a host has an incident that lasted a few readings, and another when it is over. Glances notices have a browser-notification switch of their own, and Config, then Glances, then Notices chooses per host which kinds go out. A short tour of the page plays on the first visit and can be played again from Config or Help.
What it needs, exactly
A Glances 4 server running in web mode. Glances 3 answers differently and is refused with This view needs Glances 4. A machine on your own network is refused until Allow localhost & private-network bookmarks is on in Config, then Behavior. If the install has a write token, saving settings, reading the command line of a process and deleting what was recorded ask for it; looking does not. A Glances login is only for a server that has a password, and the password stays on the server.
Nine sections, nine keys
The menu on the left has a section for each screen, and each has a key: o Overview, p Processes, c Containers, d Disks, n Network, i Insights, h History, a Alerts and m Hosts (only with more than one host). The menu only lists what the host can answer, so a host without the containers plugin has no Containers section. Shift + G opens the page, :glances processes opens a section, and :glances host <name> opens another host.
- 9sections
- 5hosts at most
- 6steps in the tour
Disks show usage by role (array, cache and pools, system) with when each is full, disk I/O, SMART and RAID. Network shows speed in and out per interface, connections and Wi-Fi. Alerts lists the alerts Glances itself raised. The Overview can be trimmed under Config, then Glances, then Page, where Overview shows picks the blocks.
Colours, lines and units
Colour follows two lines, Yellow from and Red from, which Config sets for the processor, memory, swap, disks and temperature. A sensor that reports limits of its own uses those. The lines colour the page, the dot on the header icon and the incidents. Temperatures follow the weather’s unit: with Fahrenheit picked in Appearance, the page shows degrees Fahrenheit, while the temperature lines in Config stay in Celsius.
The record, in detail
Record every offers 2, 5, 10 or 30 seconds, 1, 5, 15 or 30 minutes, or an hour. Keep offers 7, 30 or 90 days. Recent minutes are kept as they were, a day is averaged, and older data is averaged more, so a month stays small. The record keeps going with the page closed, and a host that did not answer leaves a gap, not a line down to zero. Each graph has its own range, and , and . make the graph under the pointer shorter or longer. Compare with lays Yesterday or Last week behind today as a dashed line, where the record reaches back that far.
Processes and containers are recorded only when you ask, from their side panels, because reading every one costs the host some processor. At most fifteen at a time, and all processes with one name are recorded together. Record the busiest by itself under Config can pick the 3 or 5 busiest for you.
Where Glances and Containers meet
When a Glances host runs on the same machine as the Docker host, their containers are the same ones. Under Config, Glances, Advanced, Same machine as the Containers view is Auto, Yes or No; Auto compares host names. Only one host can be the Docker host. Then an arrow in the Glances Containers section opens the container in the Containers view, the Containers side panel gets a From Glances part, and the moments a container restarted are marked on the Glances graphs as dashed lines. If the two are linked but not one container could be paired, Config and the Containers view say why.
Config, in five tabs
Each host has a button in the bar at the top, with Add a host and Remove this host beside them (removing a host deletes what was recorded about it). Below are five tabs: Connection, Page, Recording, Notices and Advanced. Each panel has a badge, This host or All hosts, so you know what a change reaches. Which disks count takes a prefix to cut from every mount point (/rootfs, when Glances runs in a container) and mounts to hide. Changes save a moment after you stop, and a changed address is tested at once.