The server log
Read what the server is doing, in the app: levels, filters and an activity trail.
When something goes wrong on a server, the first question is what it was doing. nextDash answers inside the app: Config, then Logs, shows what the server has been up to — checks, imports, saved copies, backups, failed writes and every request — without a shell on the machine. The same lines go to the container log, so docker logs says the same thing.
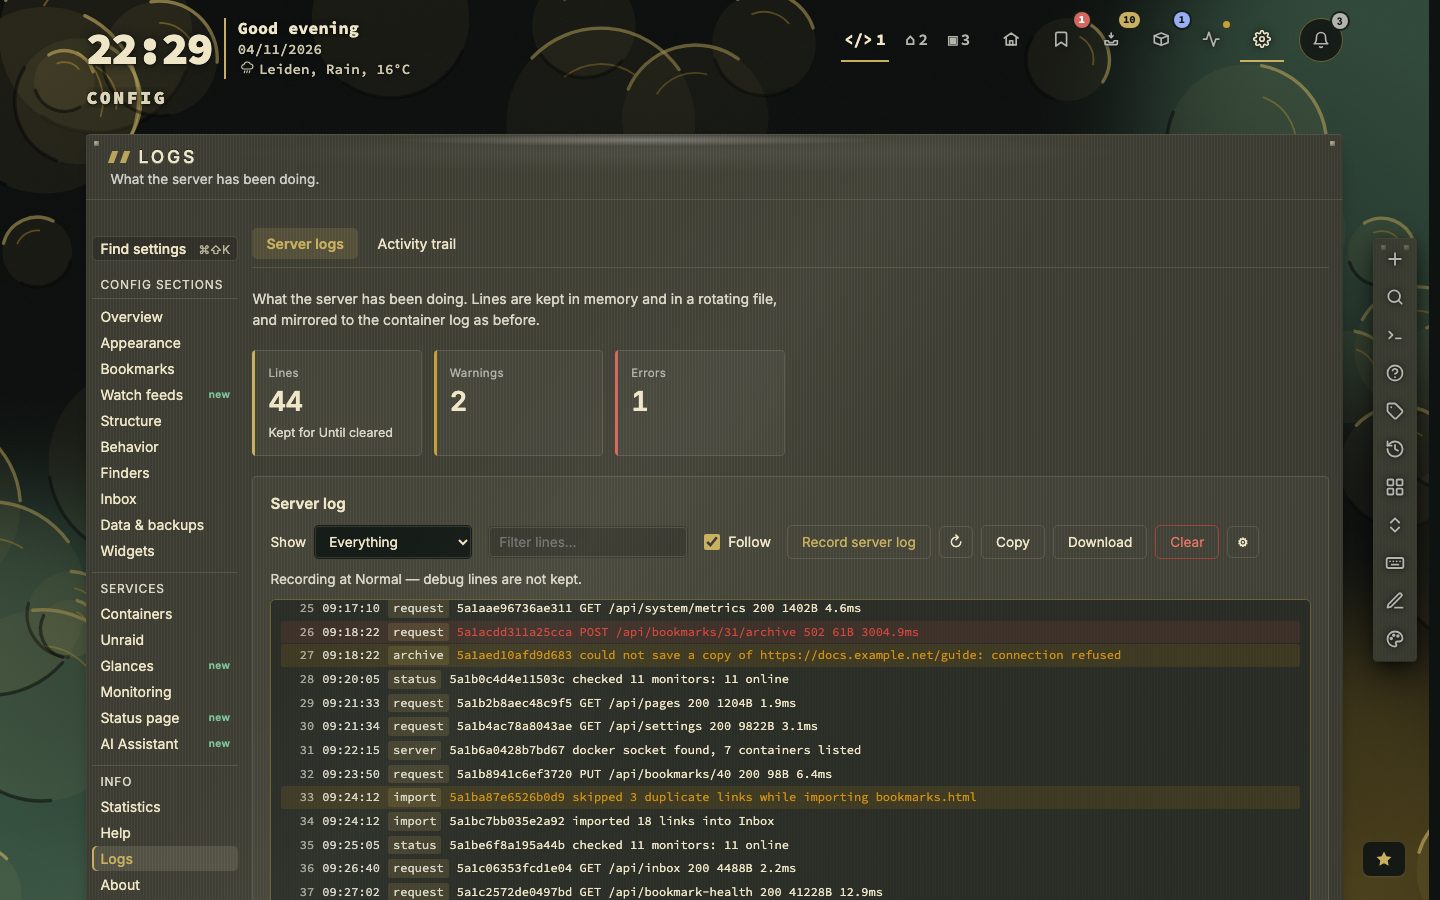
Every line has a sequence number, a time, the part of nextDash it came from and a sentence written for the person running it. Warnings are amber and errors are red. Three tiles at the top count the lines, the warnings and the errors.
Try it
- Open Config, then Logs. On a fresh install the log is off: press Record server log.
- Do something: run a link check from the Bookmarks view, or import a file under Config, then Data & backups.
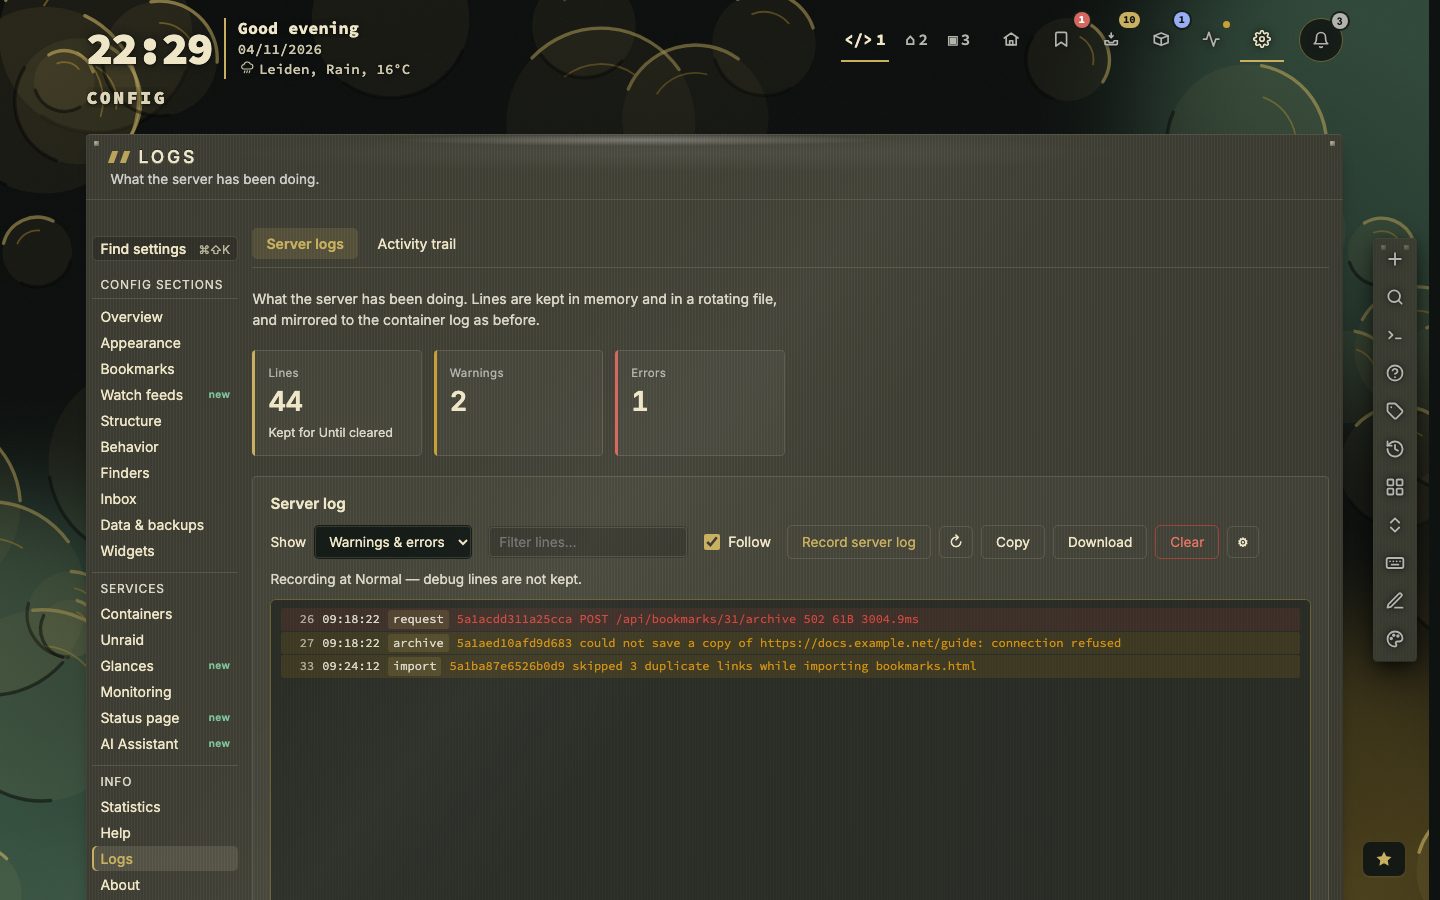
- Open Show and pick Warnings & errors. Everything else steps aside.
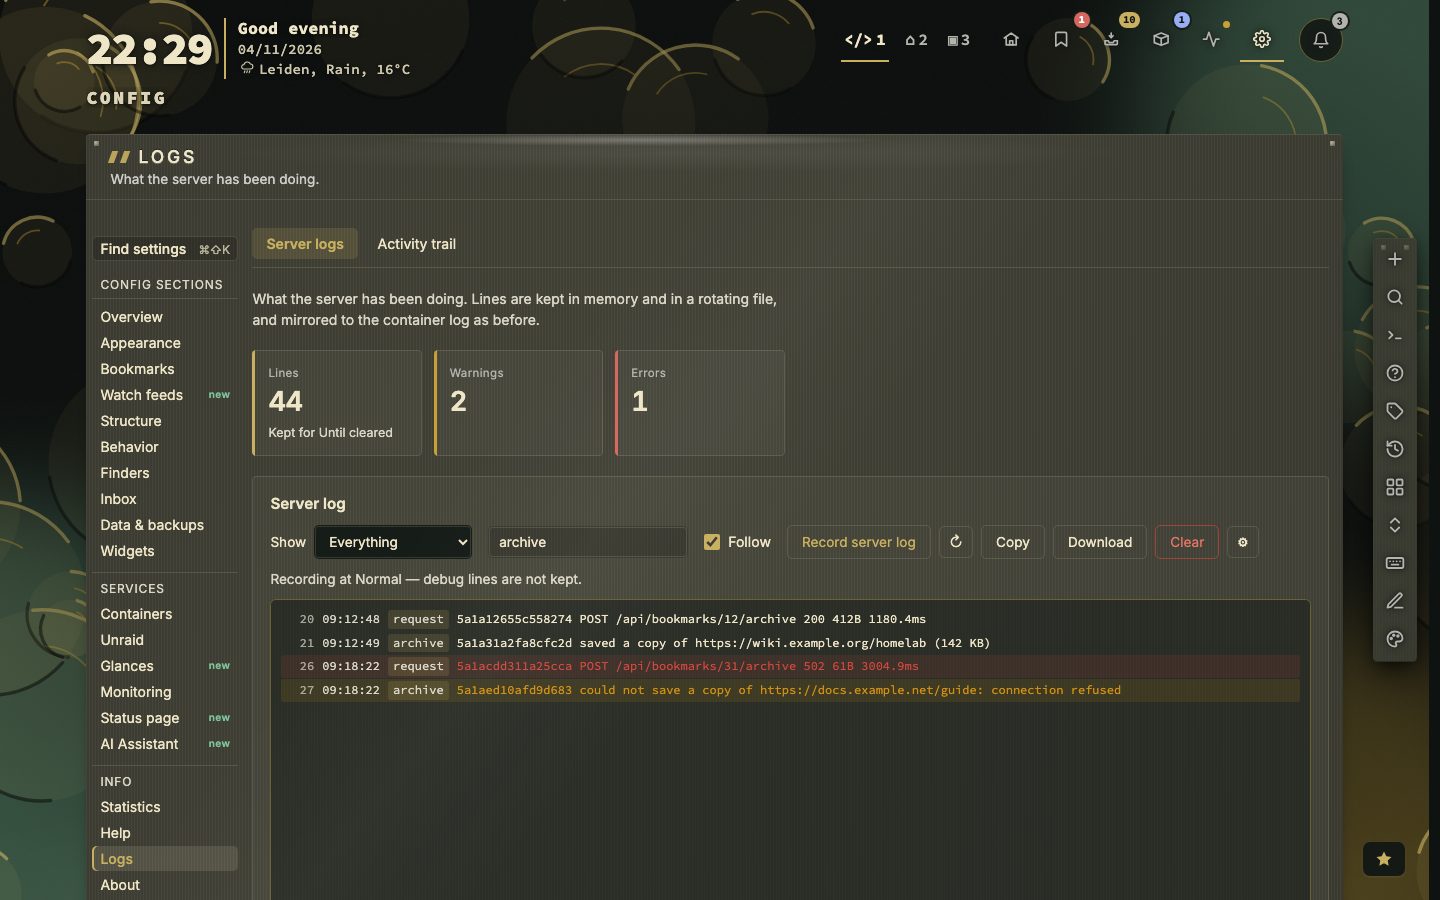
- Type a word in Filter lines, for example
archive.
Read what matters
Show narrows the view to everything, warnings and errors, errors only, or activity only. It changes what you see, not what is recorded. The Filter lines field searches the message and the part it came from across the whole log, not just the lines on screen. Follow keeps the newest line in view until you scroll up, Copy puts the lines on the clipboard and Download saves them as a .log file.
How much, and for how long
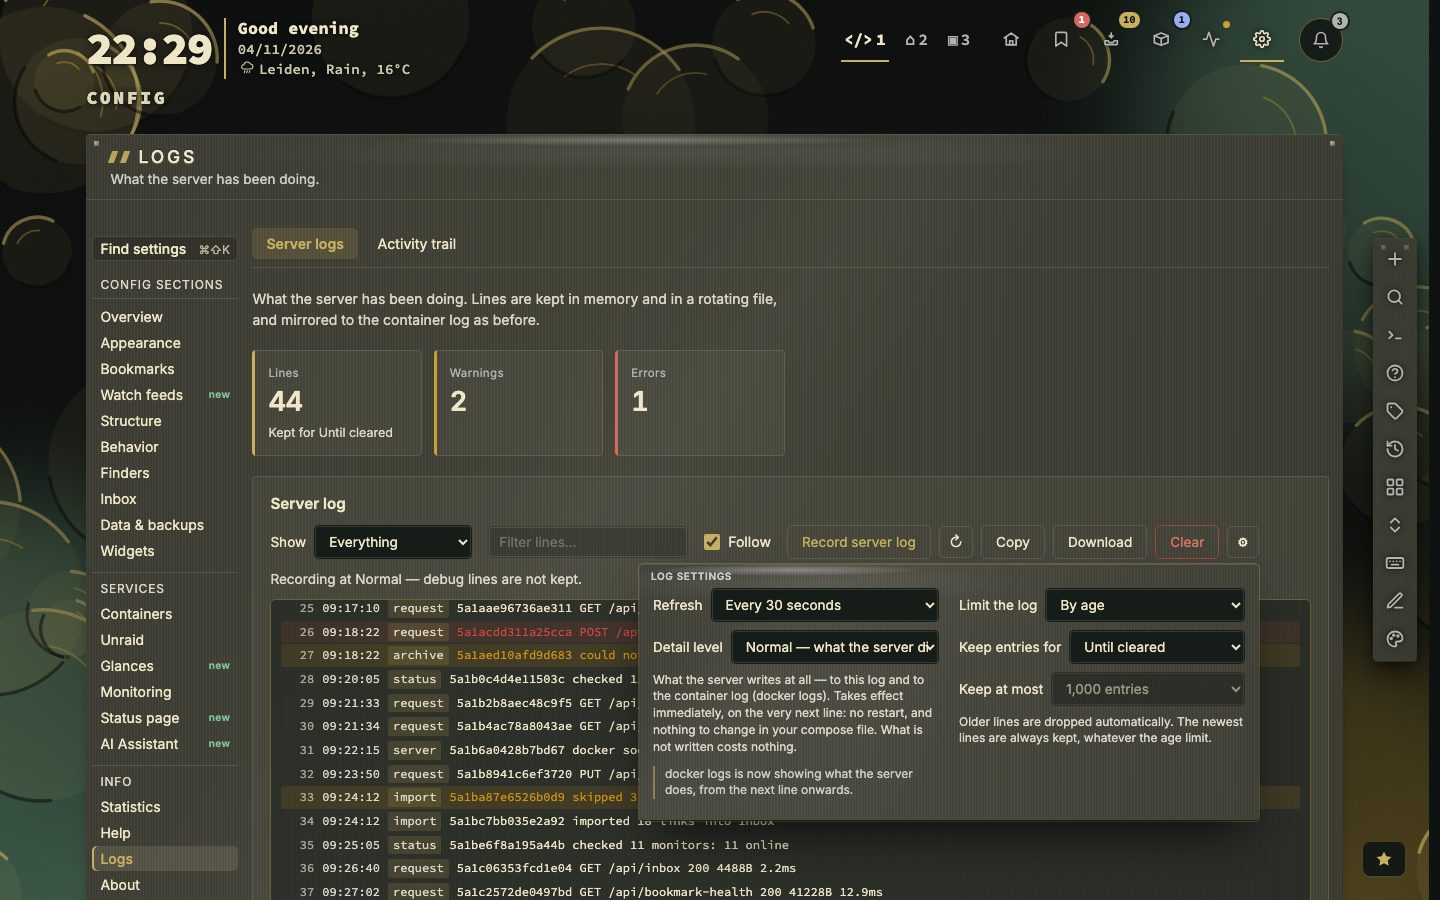
The cog beside the buttons holds the log settings. Detail level is Quiet (problems only), Normal (what the server did, the default) or Verbose (every step). It takes effect on the very next line, without a restart, and in the container log too. Limit the log keeps it by age (from one hour to 30 days, or until cleared) or by the number of lines (100 to 5000). Refresh makes the view update by itself every 2, 5, 15 or 30 seconds while the tab is open; with it off, press the refresh button for the newest lines. Clear empties the log and the files behind it, and asks first.
What is kept, and who can read it
Recording is off until you switch it on, and while it is off nothing is captured or written. Lines are kept in memory and in server.log in your data folder (2 MB, with two rotated copies). Anyone who can open Config can read this log, including full webhook addresses where they were logged, so treat it like the rest of Config.
The activity trail
Beside the readable log, the Activity trail tab keeps a machine-readable record, one JSON line per event, for the kinds of event you choose: changes, check results, refused access, health rounds, imports, feed polls, saved copies, backups, failed writes, widget requests and alerts sent; bookmarks opened, searches, keyboard shortcuts, navigation and dashboard loads; and errors from the browser. Changes and check results are on by default and the rest are off. URLs and searches can appear in the trail, so treat the files as private.
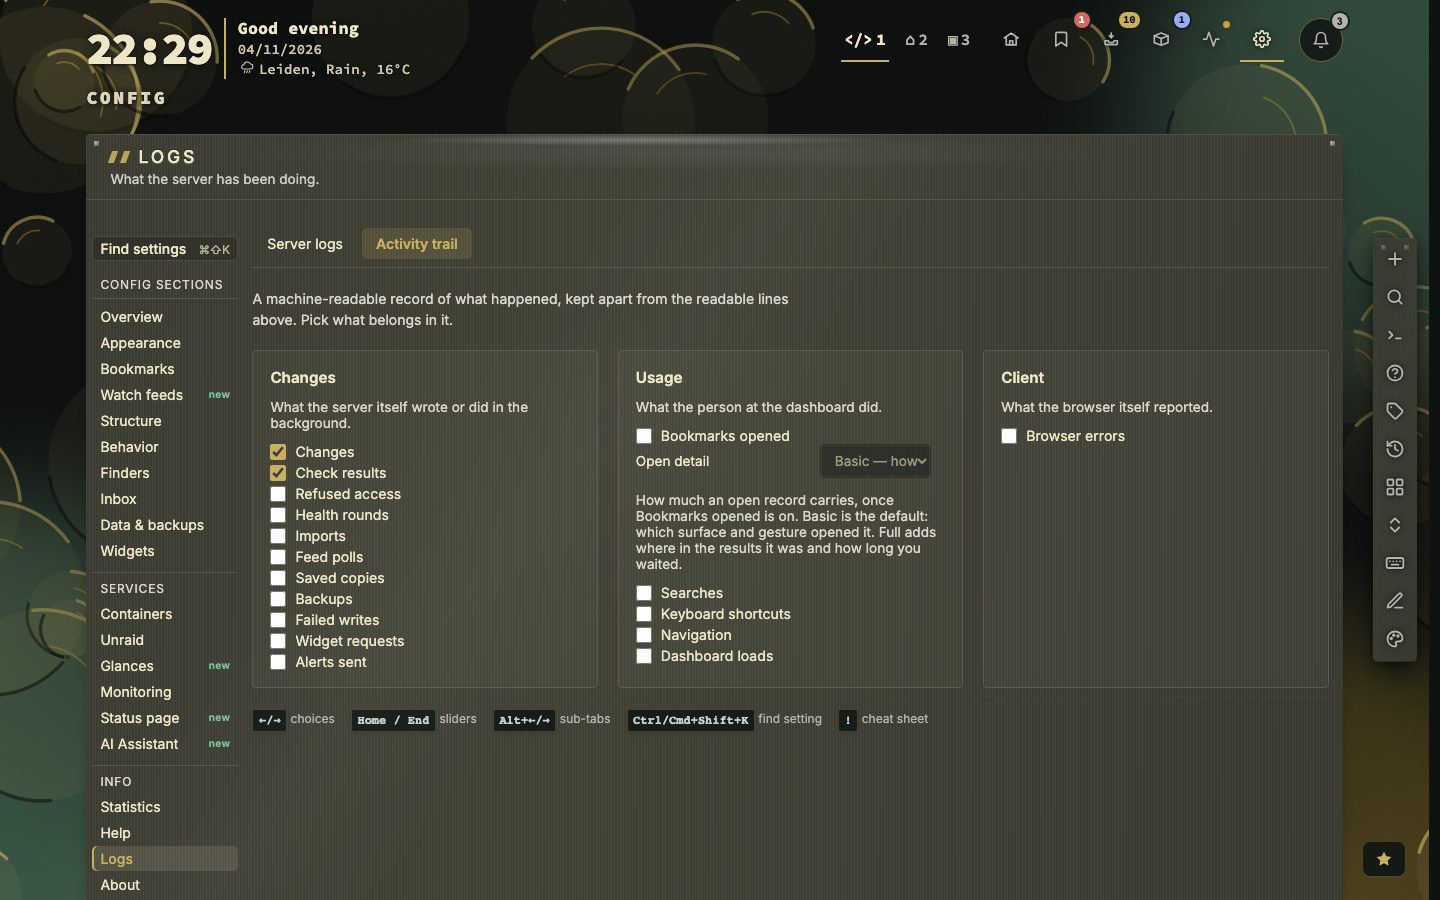
The details, including the environment variables that set the same things for the whole server, are in the manual, chapter 21.
Three lines, three meanings
A line starts with its level: INFO for what the server did, WARN for something that did not go as hoped, ERROR for something that failed. Then comes the part of nextDash it came from and a sentence. The lines below are the kind you will see.
INFO   health   checked 110 bookmarks, 2 failed, 1.4s
WARN   archive  dash.example could not be saved: the page is behind a login
ERROR store bookmarks.json could not be written: no space left on deviceThe filter looks at both the message and the part, so a word such as archive finds the lines of that part and every line that mentions it. The tiles at the top stay out of the way until the log has a line.
- 3detail levels
- 2MB for server.log
- 2rotated copies
- 30days at most
What each control does to the log
- Record server log is off by default. While it is off nothing is captured and nothing is written, and turning it off again keeps what was collected.
- Show changes only what you see, not what is recorded. A note says which level is recording.
- Limit the log keeps lines by age (one hour to 30 days, or until cleared) or by number (100 to 5000), one or the other.
- Refresh is off, or every 2, 5, 15 or 30 seconds while the tab is open. With it off, a note says the view does not update by itself and the refresh button fetches the newest lines.
- Clear empties the log and deletes
server.logand its rotated copies. It asks first.
Every line carries its own sequence number from the server. The same lines go to stderr, so docker logs shows the same sentences.
Setting the log for the whole server
Environment variables set the same things for every browser and every restart, and a choice made in the app wins over them. NEXTDASH_LOG_LEVEL takes error, warn, info or debug. NEXTDASH_ACTIVITY_LOG takes a list of channels, such as mutate,status,security, or off. NEXTDASH_ACTIVITY_LOG_PERSIST=1 writes data/activity.log.
More about the activity trail
One event is one line of JSON, kept apart from the readable log, for example:
{"ts":"2026-07-03T12:00:00Z","event":"bookmark.add","pageId":1,"name":"GitHub","url":"https://github.com","source":"dashboard"}The trail goes to the log buffer, where Show then Activity only picks it out while recording is on. With persistence on it is also written to activity.log. The container log gets a readable sentence for the same event, and verbose lines never enter the trail. Status checks for the same URL and result are logged once per ten minutes.
Open detail decides what a bookmark opened record holds: Off (just the open), Basic (how it was opened, the default) or Full, which adds its rank in the results and the wait. NEXTDASH_ACTIVITY_LOG_URLS can be full (the default), host or off, to keep addresses out of the files, and NEXTDASH_ACTIVITY_LOG_SAMPLE records only a share of the busy channels. Reset panel restores the defaults.