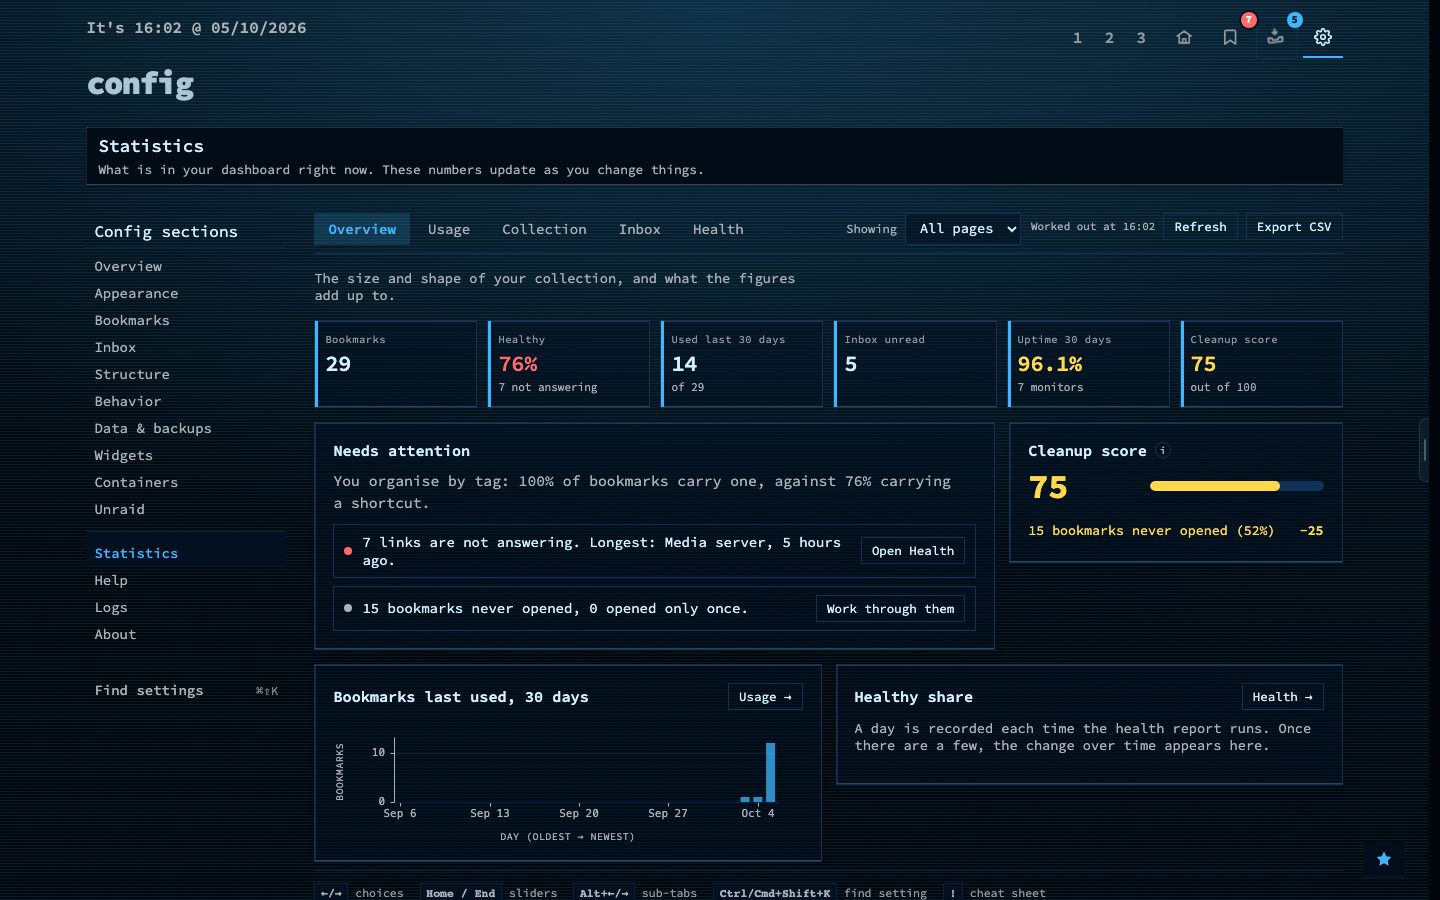
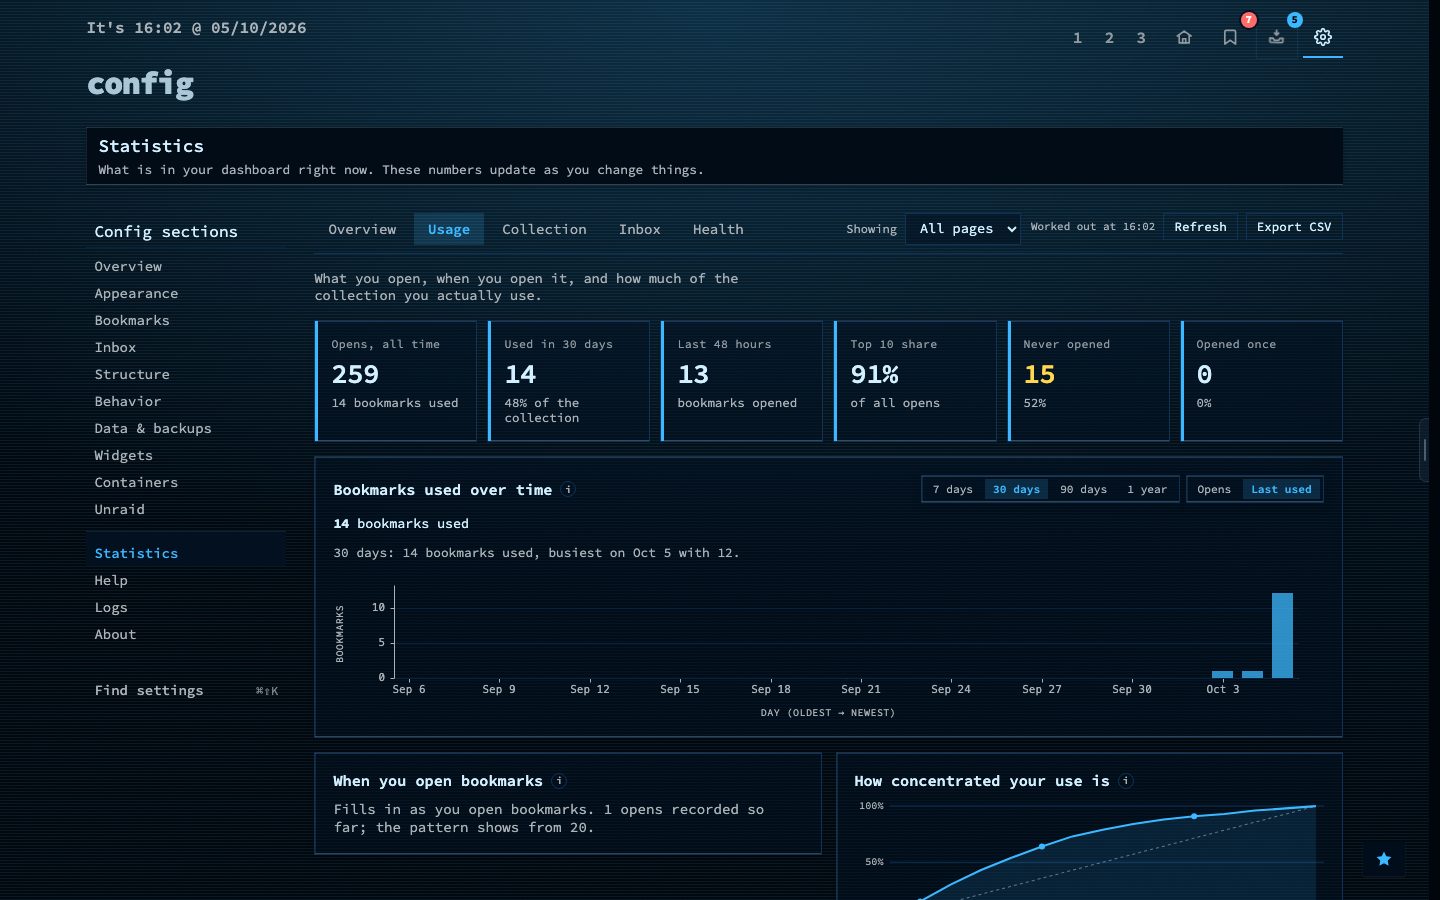
Statistics counts what you have and what you use, all worked out from the data on your own server. Every tab opens with a line on what it is about and a row of six figures, with the direction since last week. Below them, panels explain themselves with a small info mark.
The tabs: Overview, Usage, Collection, Inbox and Health. Overview shows what needs attention, such as links that stopped answering, a certificate close to expiry or unread inbox items that have waited too long, plus a cleanup score. Usage shows what you open, when you open it and how concentrated your use is. Collection shows how it grew and which bookmarks are cleanup candidates. Click a tag or a row to see the bookmarks behind it.
If you have more than one page, narrow every figure to a single page. Each tab has a link you can copy, and everything can be exported as CSV.
Try it
- Open Config and choose Statistics.
- Look at what needs attention on the Overview tab.
- Open Usage to see which bookmarks you really use, then export a tab as CSV.