A bookmark collection rots quietly. Nothing on the dashboard changes on the day a link dies, a domain moves, a certificate expires or a page you saved four years ago turns into a parked ad. The health view is where all of that is written down — and, more to the point, where it can be worked through.
Save a link and it is a promise about the future: this will still be here when I want it. Every promise like that is broken eventually, and none of them announce it. The row on your dashboard looks the same on the day the site goes away as it did on the day you saved it.
That leaves you with two habits, both bad. Either you click something to find out — which is how you discover a dead link at the exact moment you needed it — or you stop trusting the collection and start searching the web again for things you already filed.
Health
is the answer to that, and the first thing worth knowing about it is how little of it you have to switch on. Open
/#health
on a fresh install and it already has a report for you: what is duplicated, what has no preview, which two bookmarks are fighting over the same shortcut key, what you saved and never opened once, and what you have not opened in over a month. None of that needs a network request, a setting or a decision. It is arithmetic over what nextDash already holds.
The half that does reach the internet — is this link still answering, how fast, with what certificate, and did the page turn into something else — is opt-in per bookmark, and one keystroke to turn on.
This article covers what the view does, how the checking actually works, what it costs, and — the section most people want first — how much setting up any of it takes.
01. What you get before configuring anything
Open it with the heartbeat icon in the header,
Shift+H
,
:health
from the search bar, or a
/#health
link. The layout is the same three bands every time:
Summary tiles (click to filter)  →  one row of filter pills, search, sort
                                            ↓
                        the feed: one row per bookmark, worst first
The tiles across the top are not decoration — every tile is a filter . Click Stale 7 and the list below becomes those seven. Click Certificates and you get the bookmarks on the hosts whose certificates are close to expiry. Total , Healthy and Monitored are always drawn, because they describe the collection and a zero in them is a real answer; the rest — Broken, Content, Unchecked, Stale, Unused, Drift, Certificates — appear only when they have rows behind them. A tile that would say 0 is a tile that is not there.
The five things it can tell you with no checking switched on at all:
| Duplicates | The same address saved twice, grouped |
| Shortcut conflicts | Two bookmarks claiming the same key — which means neither is reachable by it |
| Missing preview | No title, description or image was ever fetched for the page |
| Stale | Not opened in over 30 days |
| Unused | Never opened at all |
Stale and Unused sound alike and are not the same question , which is why each tile explains its own rule on hover. Not opened in thirty days is a habit; never opened once is a decision you made and then did not follow through on, and it is usually the more interesting of the two.
Under the toolbar, a sentence states in words what the active filter is selecting — including on an empty one, which is exactly the moment when what was being looked for is the only useful thing left to say.
02. The score, and what it charges for
Every row carries a number from 0 to 100. Press
s
on it, or click the badge, and it unfolds into the arithmetic:
| Charged | Cost |
|---|---|
| Broken — the link did not answer | −60 |
| Duplicate address | −15 |
| Shortcut conflict | −15 |
| Never checked | −10 |
| The last check is old | −5 |
| No preview metadata | −5 |
Usage costs nothing. Never opened and not opened in 30 days are listed under worth knowing, at no cost to the score — they still drive the Unused and Stale tiles and filters, but they take no points off.
That is a deliberate correction rather than a rounding-down. They used to cost −10 each, and the effect was perverse: opening a bookmark — the thing this whole view is asking you to do — raised its score, and under the worst-first sort that sent the row hundreds of places down the list you were in the middle of working through. A queue that reshuffles itself as you act on it is a queue nobody finishes.
The same principle runs through the rest of the view. A row you have acted on stays where it is — re-check a broken bookmark and it drops out of what the Broken filter selects, but the row keeps its position, dimmed and marked handled , until you change the filter, sort or search. Nothing moves under your hands mid-task.
03. One bookmark can be several things at once
A link can be both a duplicate and never opened. The tiles count every condition that holds, so that bookmark is counted by both and appears under either filter. The row itself shows only its worst problem, which is what decides its colour and its position in the list.
Getting that wrong is easy and it makes the whole screen untrustworthy: until v2026.09.06.1 the filters matched on the row’s single worst problem while the tiles counted every condition, so a tile could report 2 and then list nothing when you clicked it. A count you cannot click through to is worse than no count.
Sort is worst-first by default, with name and other orders beside it. Group by site is a button next to it, and it earns its place the moment anything goes wrong upstream: one host down takes every bookmark on it with it, and grouped by site that reads as one problem, ten rows instead of ten problems.
The filter, sort and search all ride in the address bar (
hv_filter
,
hv_sort
,
hv_q
,
hv_id
), so “the seven stale ones on page 2” is a link you can keep, and your last filter comes back on your next visit.
04. Switching checking on: Off, Periodic, Monitor
Here is the whole of the setup story for availability, and it is one key.
Press
c
on a row — or click the mode badge on it — and a short menu offers three modes:
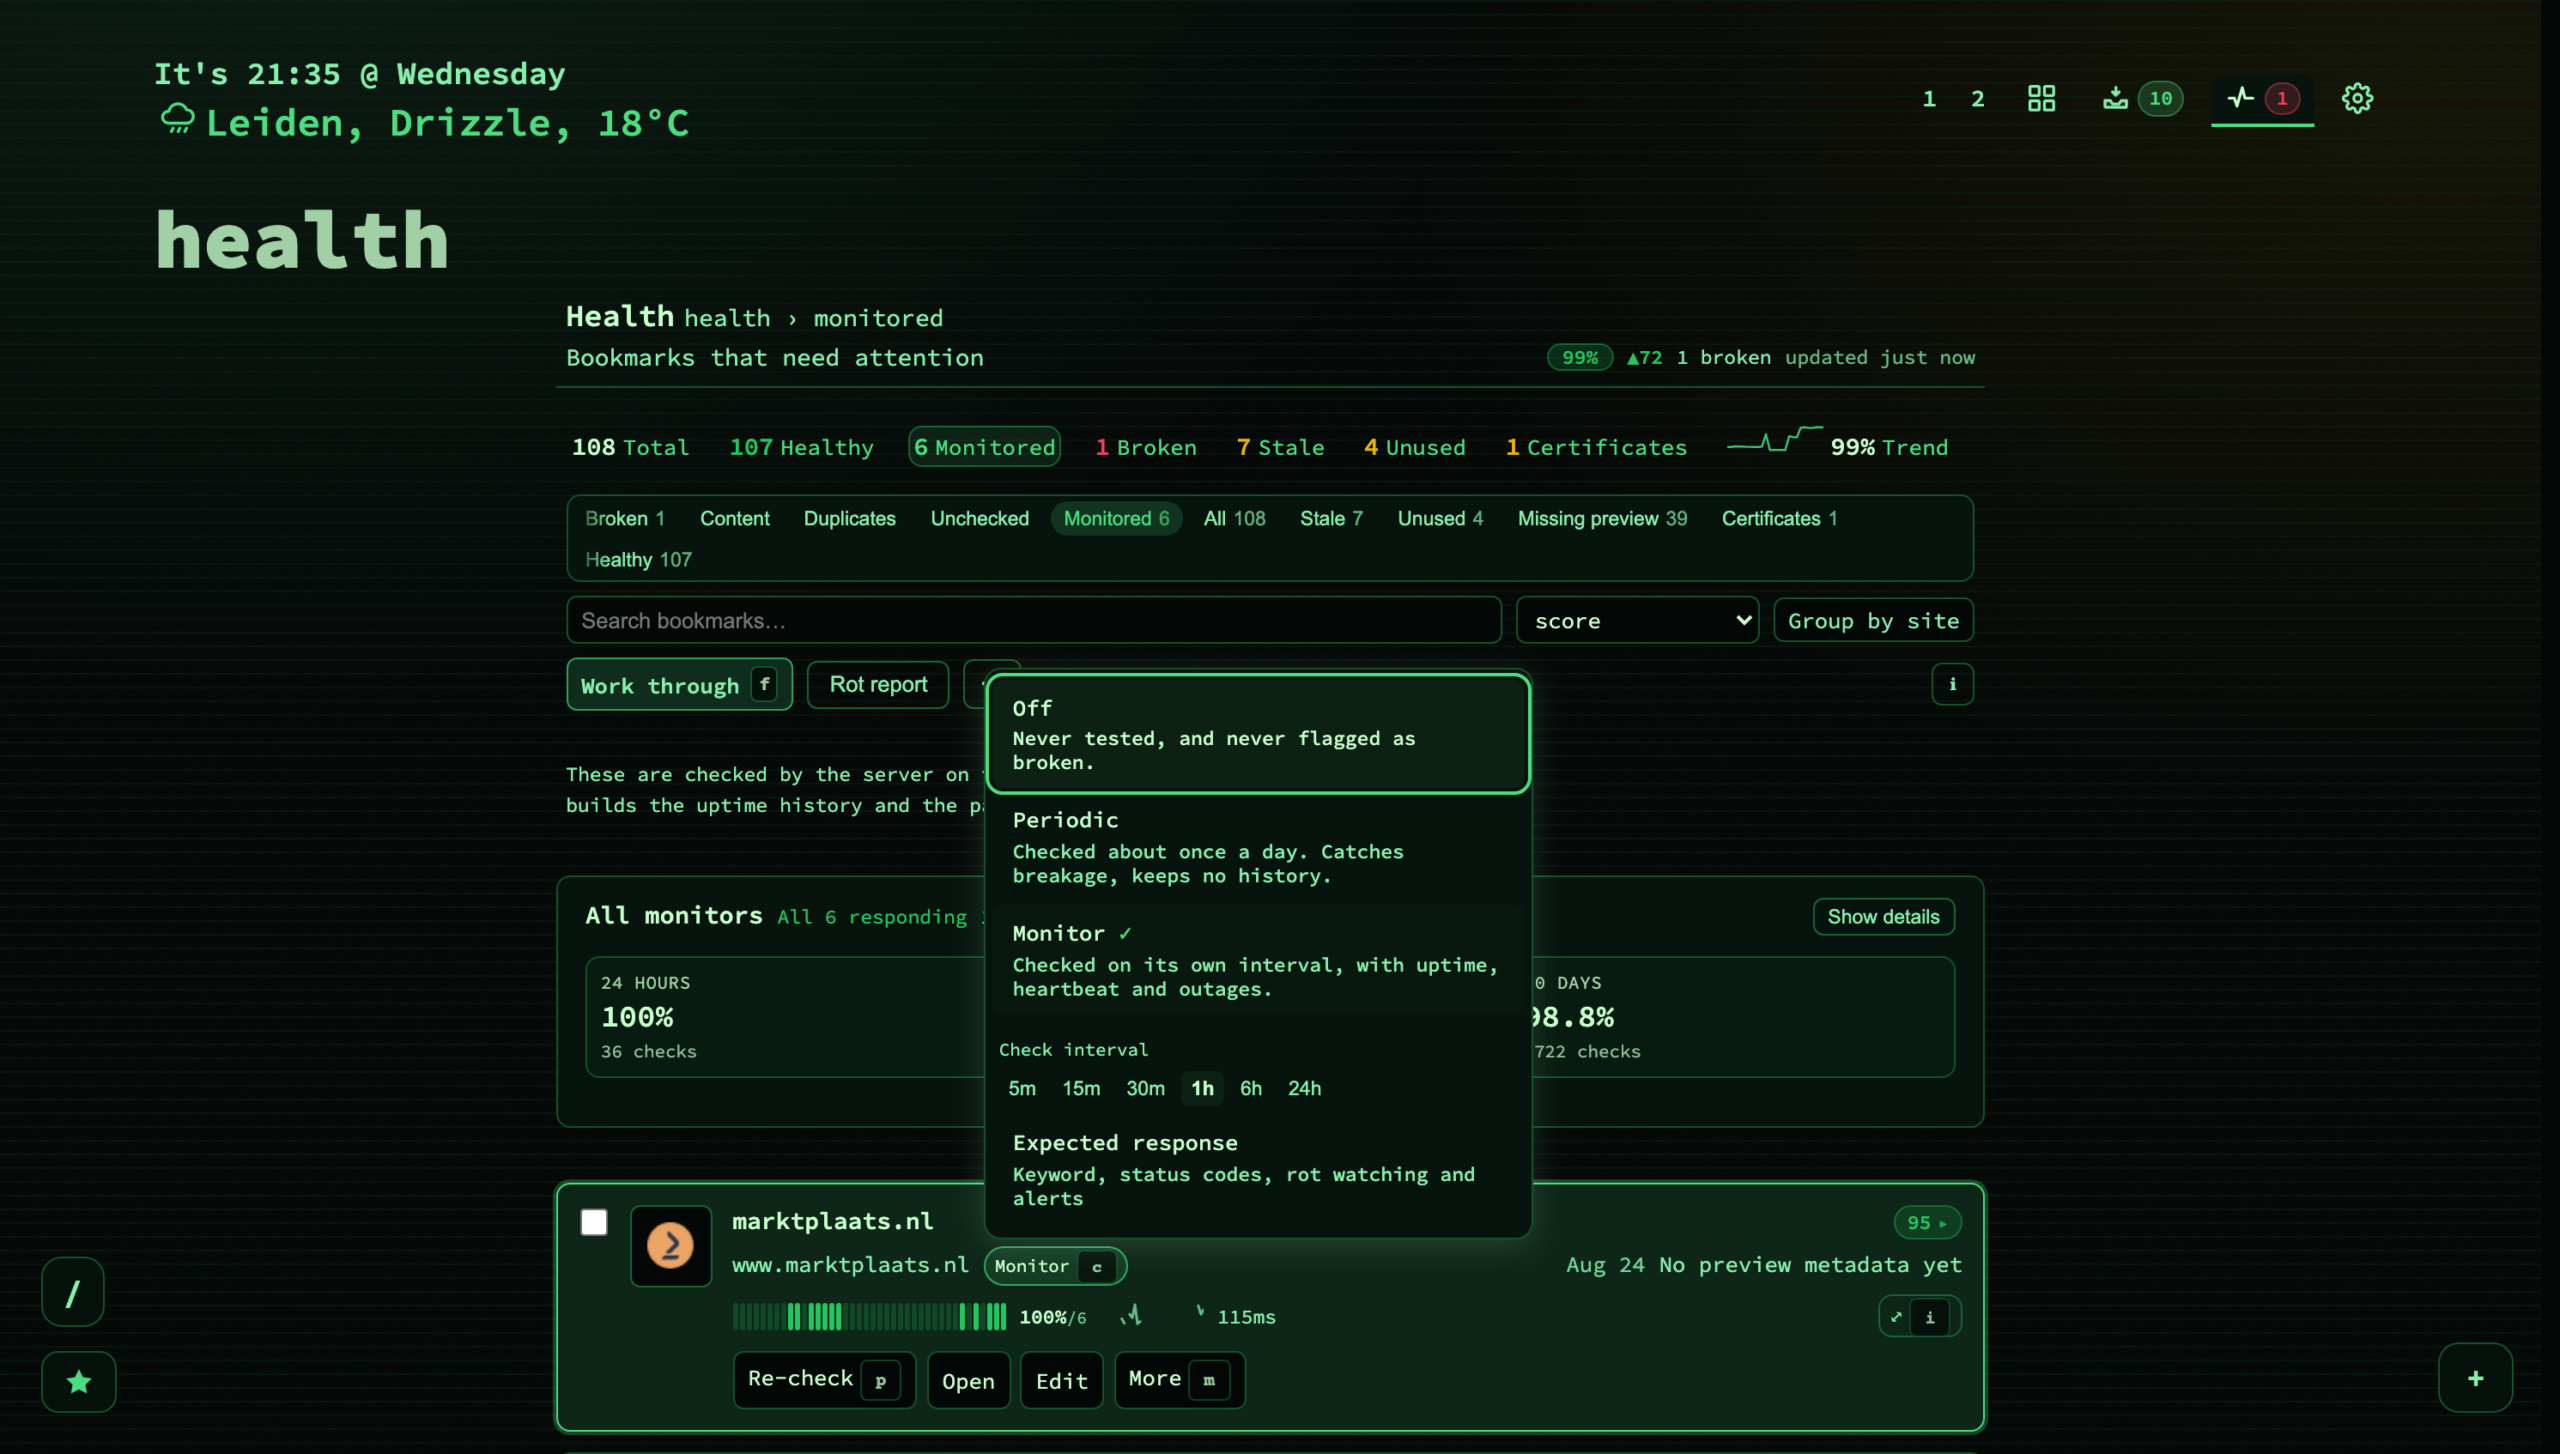
Off is the default for every bookmark, and it is a real default rather than a shrug: nothing reaches out to the sites behind your links until you say so, on the bookmarks you choose. Periodic catches breakage at about a check a day and keeps no history. Monitor checks on its own interval — 5m, 15m, 30m, 1h, 6h or 24h, defaulting to 15 minutes — and keeps thirty days of samples, which is what the heartbeat, the uptime figures, the outage list and the alerts are all built out of. Monitor includes everything Periodic does.
The interval strip only appears on a row that is already monitoring. Picking an interval anywhere else would be a second, hidden way of turning monitoring on, and this is the screen where you look at a heartbeat and decide the cadence is wrong — so it belongs here rather than in the bookmark editor.
Doing it in bulk.
On a
filtered
list, a button offers to switch every visible row to Periodic or Monitor at once, and confirms the exact count before it does. It is deliberately never offered on the unfiltered
All
list: “monitor everything” points the scheduler at your entire library, and there is no button for it anywhere in the app.
:monitor on
from the search bar opens the health view filtered to the never-checked bookmarks, which is the same idea from the other end.
The global settings — the ones that apply to how checks are carried out rather than to which bookmarks get them — sit under Config → Behavior → Status & health , and the panel opens by explaining the three modes rather than presenting a wall of switches:
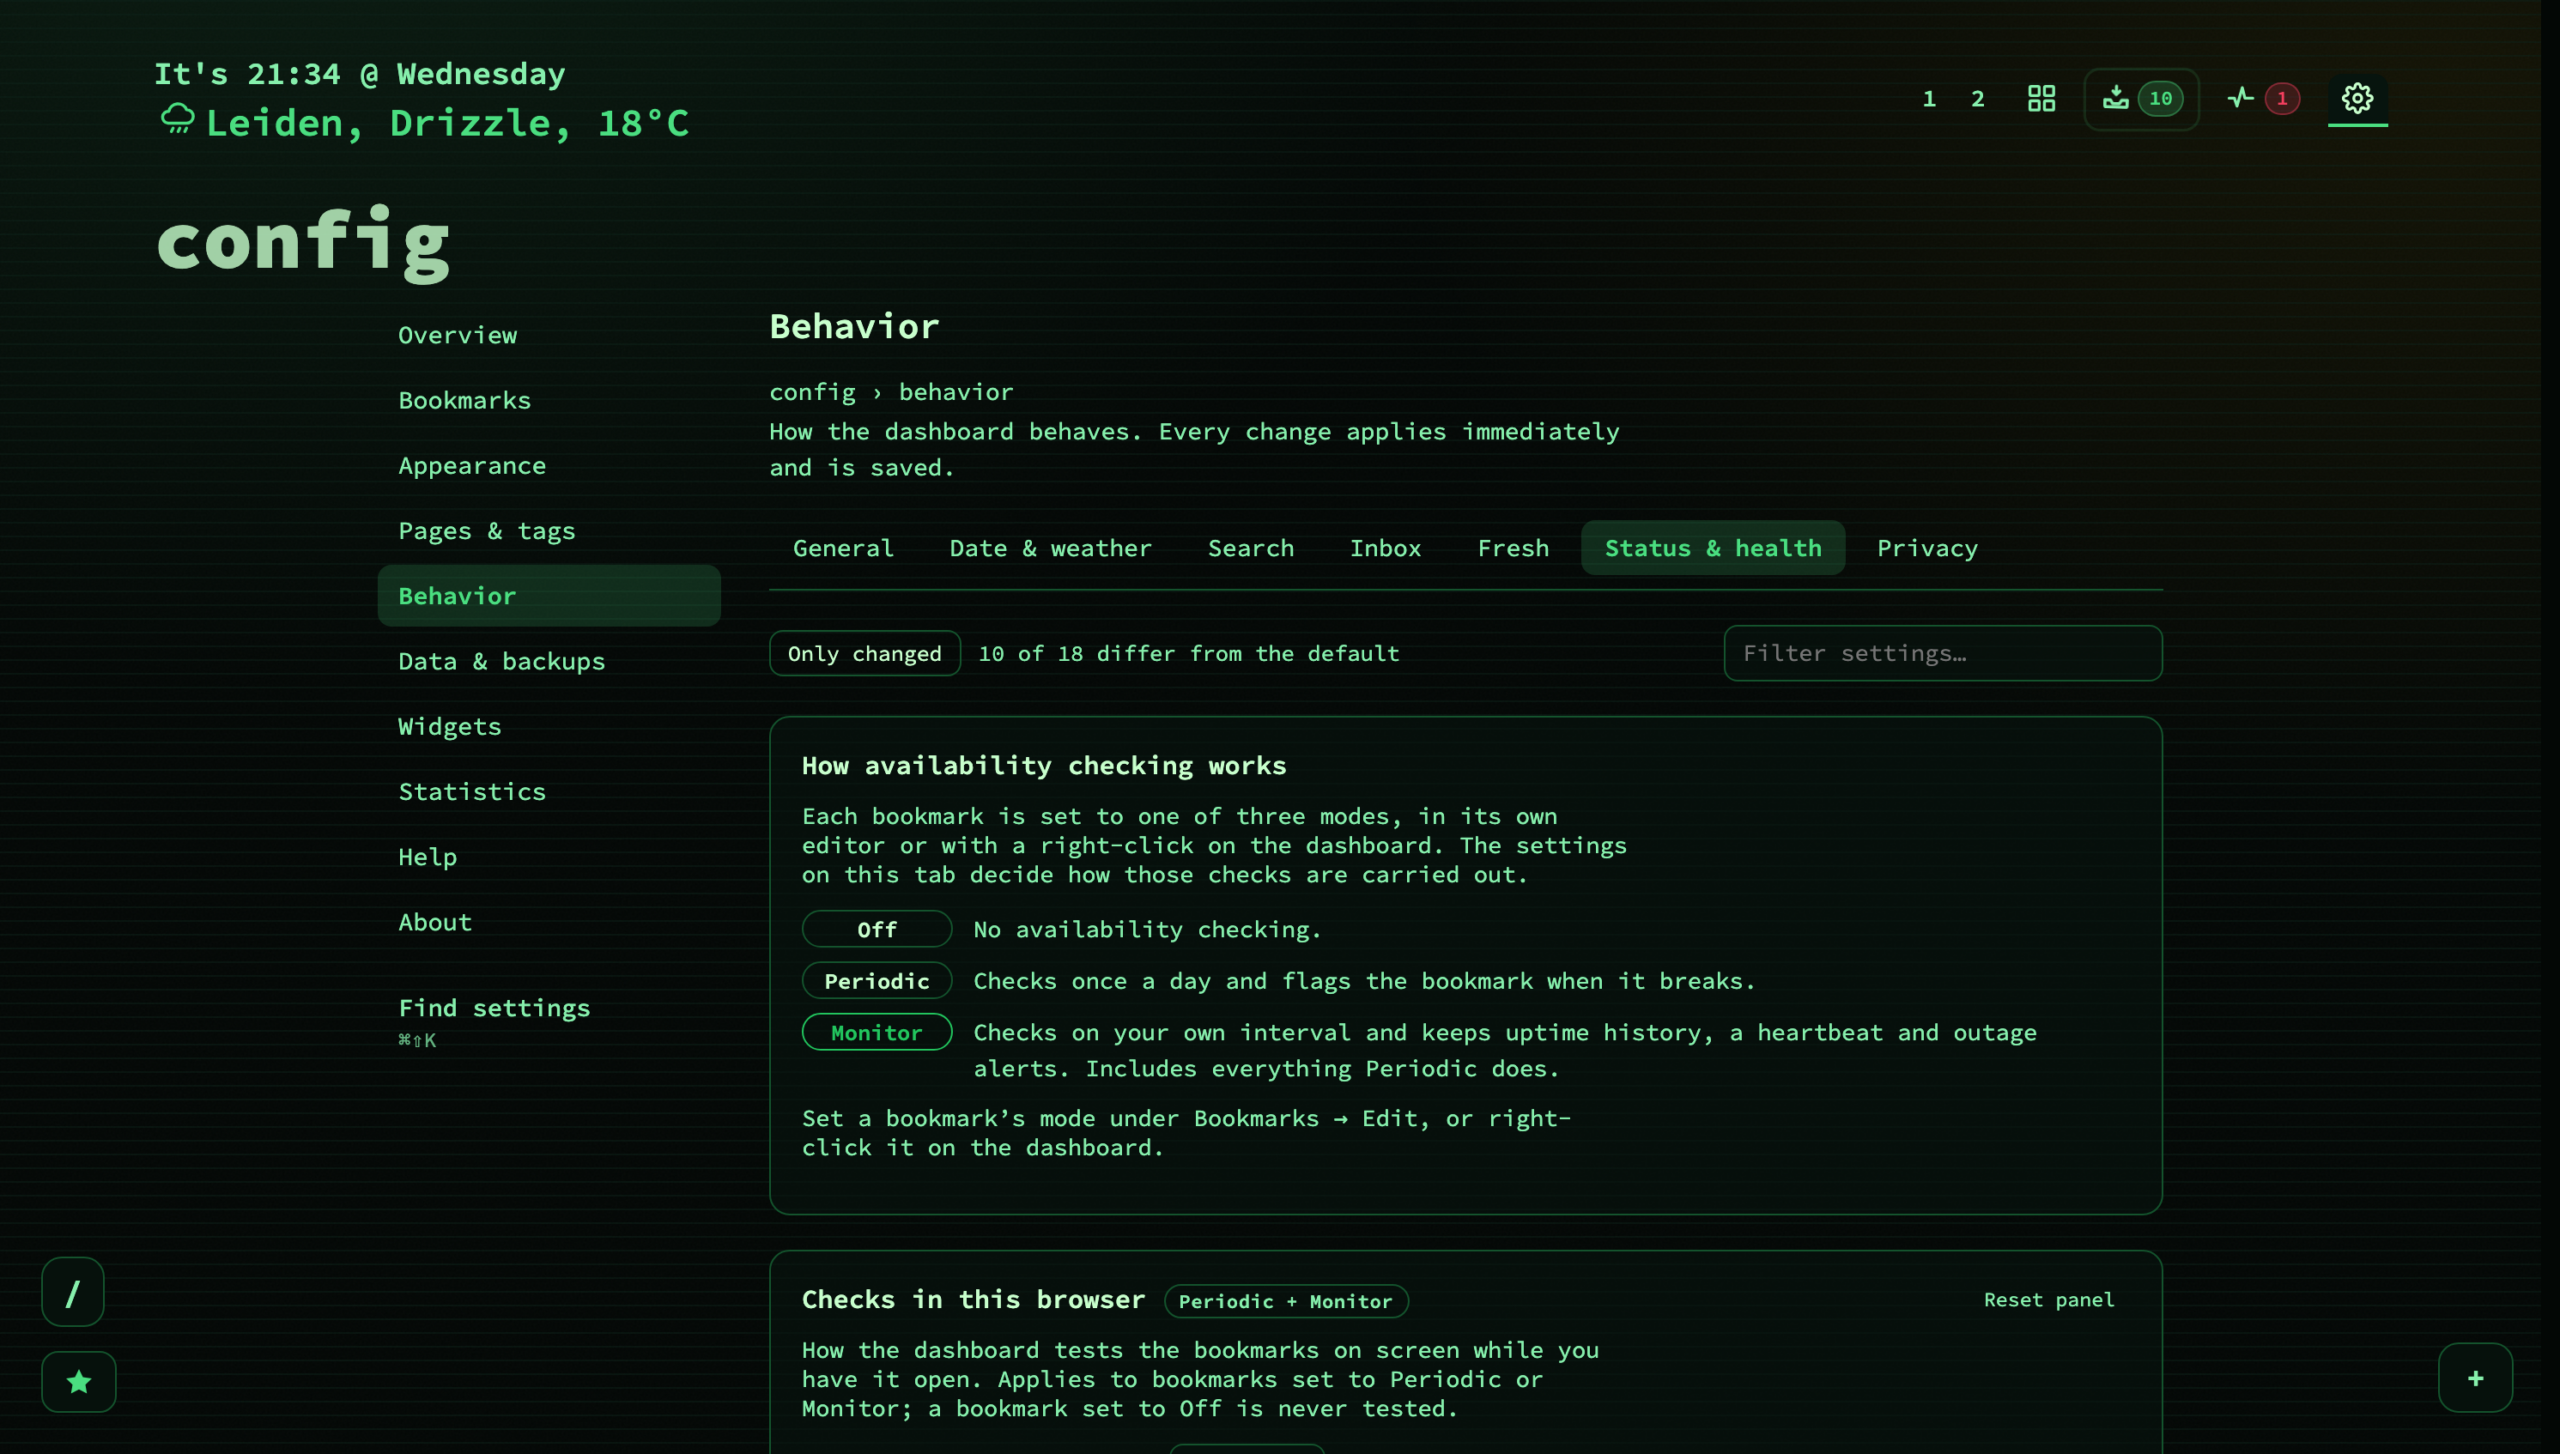
The ones worth knowing about:
| Setting | Default |
|---|---|
| Background health rechecks — the server re-pings checked bookmarks on a schedule, so the report is current without you pressing Retest all | Off; 6h to weekly, 24h when on |
| Check timeout — how long a check waits before recording a timeout | 3s; 5 / 10 / 15 / 30 offered, clamped 2–30 |
| Spot pages that answer 200 but say “not found” | Off |
| Emphasis on the dashboard — how much a monitored bookmark stands out among the rest | Only when there is a problem |
| Certificate warning lead time | 30 days (3–120) |
| Maintenance windows , downtime alerts , browser notifications | All off until you set them up |
Three seconds was hardcoded for every check until it became a setting , and the reason is the self-hosted case: a large Nextcloud, or a container that has just started, legitimately answers in four seconds and was therefore permanently Timeout , which reads on screen as offline . If you are monitoring anything on your own hardware, this is the first setting to move.
05. Saying what “up” means for this page
A reachability check asks one question — did the host answer? — and for a great many pages that is not the question you care about.
Open the availability popover on a monitored row and choose Expected response , and the row expands into a panel in place. (It used to be a form inside the popover, where five of its controls sat below a scrollbar with Save among them, so it was possible to fill everything in with no visible way to store it. In the row it gets the full width.)
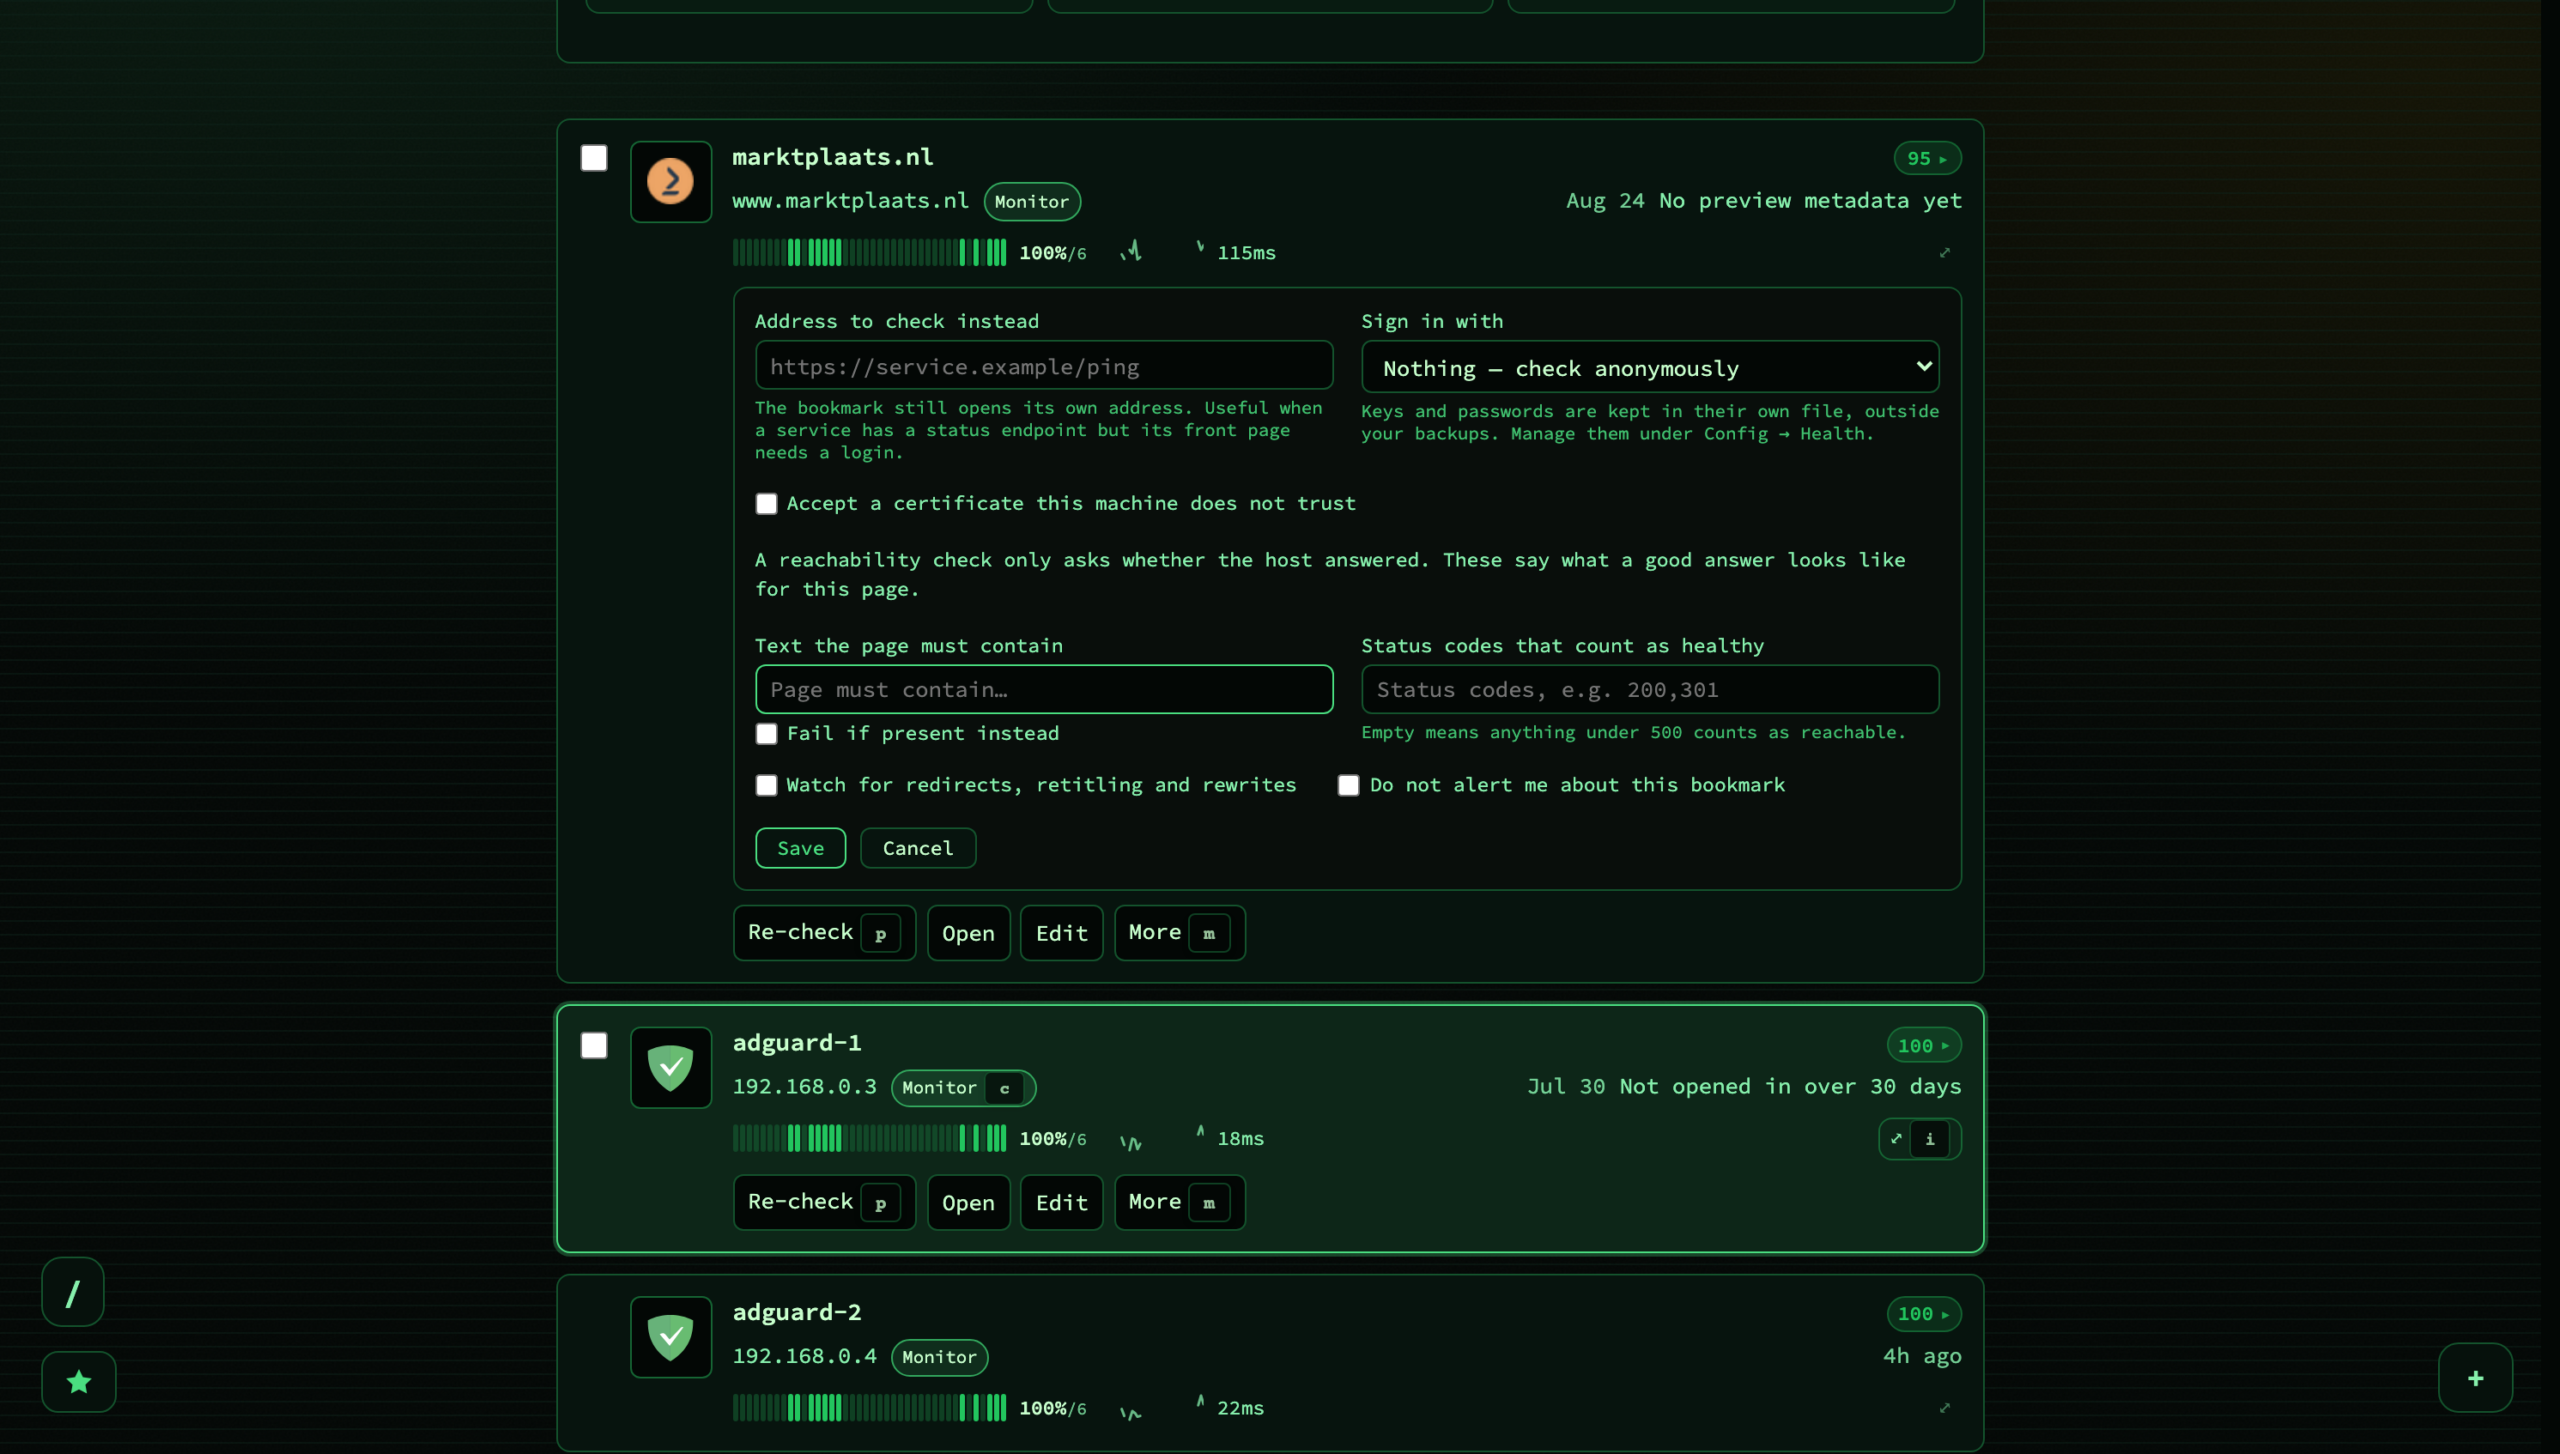
| Field | What it is for |
|---|---|
| Address to check instead | The bookmark still opens its own address. Useful when a service has a status endpoint but its front page needs a login |
| Sign in with | One of the stored health sign-ins, by name |
| Text the page must contain | A phrase that only appears when the page works — or tick Fail if present instead to catch an error banner |
| Status codes that count as healthy |
200
,
200-299
,
200,301,401
. Empty means anything under 500
|
| Watch for redirects, retitling and rewrites | Drift: the page is still there but has become something else |
| Do not alert me about this bookmark | Still checked, still recorded, still red when it is down — only the outgoing message is withheld |
A status code you mistyped is dropped rather than obeyed , so a typo cannot take a working bookmark down. And clearing both the keyword and the code list also clears the failure they caused, because a failure caused by an expectation should not outlive the expectation.
Checking a service you have to sign in to.
A self-hosted app bookmarked at its web interface answers
not signed in
to an anonymous check, so its row reads broken while the service is perfectly fine — and the only way to stop that used to be to stop monitoring the one bookmark most worth monitoring.
Config → Data & backups → Sources → Health sign-ins
stores what a check should send: a set of headers, or a username and password that become an
Authorization
header so nothing has to be encoded by hand. Give it a name —
sonarr
,
nas:admin
— and point any number of bookmarks at that name.
Three things follow from where that is kept, and all three are on purpose:
- The bookmark stores only the name. A restored install keeps its monitoring settings and has to be told the secret again.
-
The file is
0600and is left out of backups , unless you switch stored tokens on under What a backup carries . - A sign-in does not follow a redirect off its host. If a watched service answers go and look over there , the headers are dropped at the boundary and the check continues anonymously, rather than handing your API key to whatever address the redirect named.
What one check actually does
Two of those are worth spelling out.
A single miss does not count.
A failed check is tried once more, five seconds later, and is only recorded as a failure if that fails too. One dropped packet used to write a permanent
down
: it dented the 24h, 7d and 30d uptime for as long as the sample lived, opened a one-check incident and coloured a heartbeat bucket. (The alert retry threshold was never the same thing — that holds back the
message
, not the
record
.)
A bot check is not a dead link. A site asking are you a robot was once counted as gone, which put working pages on the broken list and made the list worth less than the sum of its rows. Only answers that say the page or the host no longer exists count as gone; a challenge, a rate limit or anything else ambiguous reads as unknown .
Gone without saying so.
The most common shape of rot is a page that answers a cheerful
200
and shows
page not found
. With the setting on, a monitored check reads the page and judges the title first, then the opening of the body, in five languages. For the pages that never say it in words, it also asks the host once a day what it does with an address that cannot exist, and treats a page matching that answer in length as the same page. A site that redirects every address to a login is left alone — a not-found page answers
where it was asked
, and a gate sends you somewhere else, which is the difference that separates them.
06. What a monitored bookmark records
A monitored row grows a strip: a heartbeat bar of recent checks, uptime over 24 hours , a response-time sparkline , and the last ping.
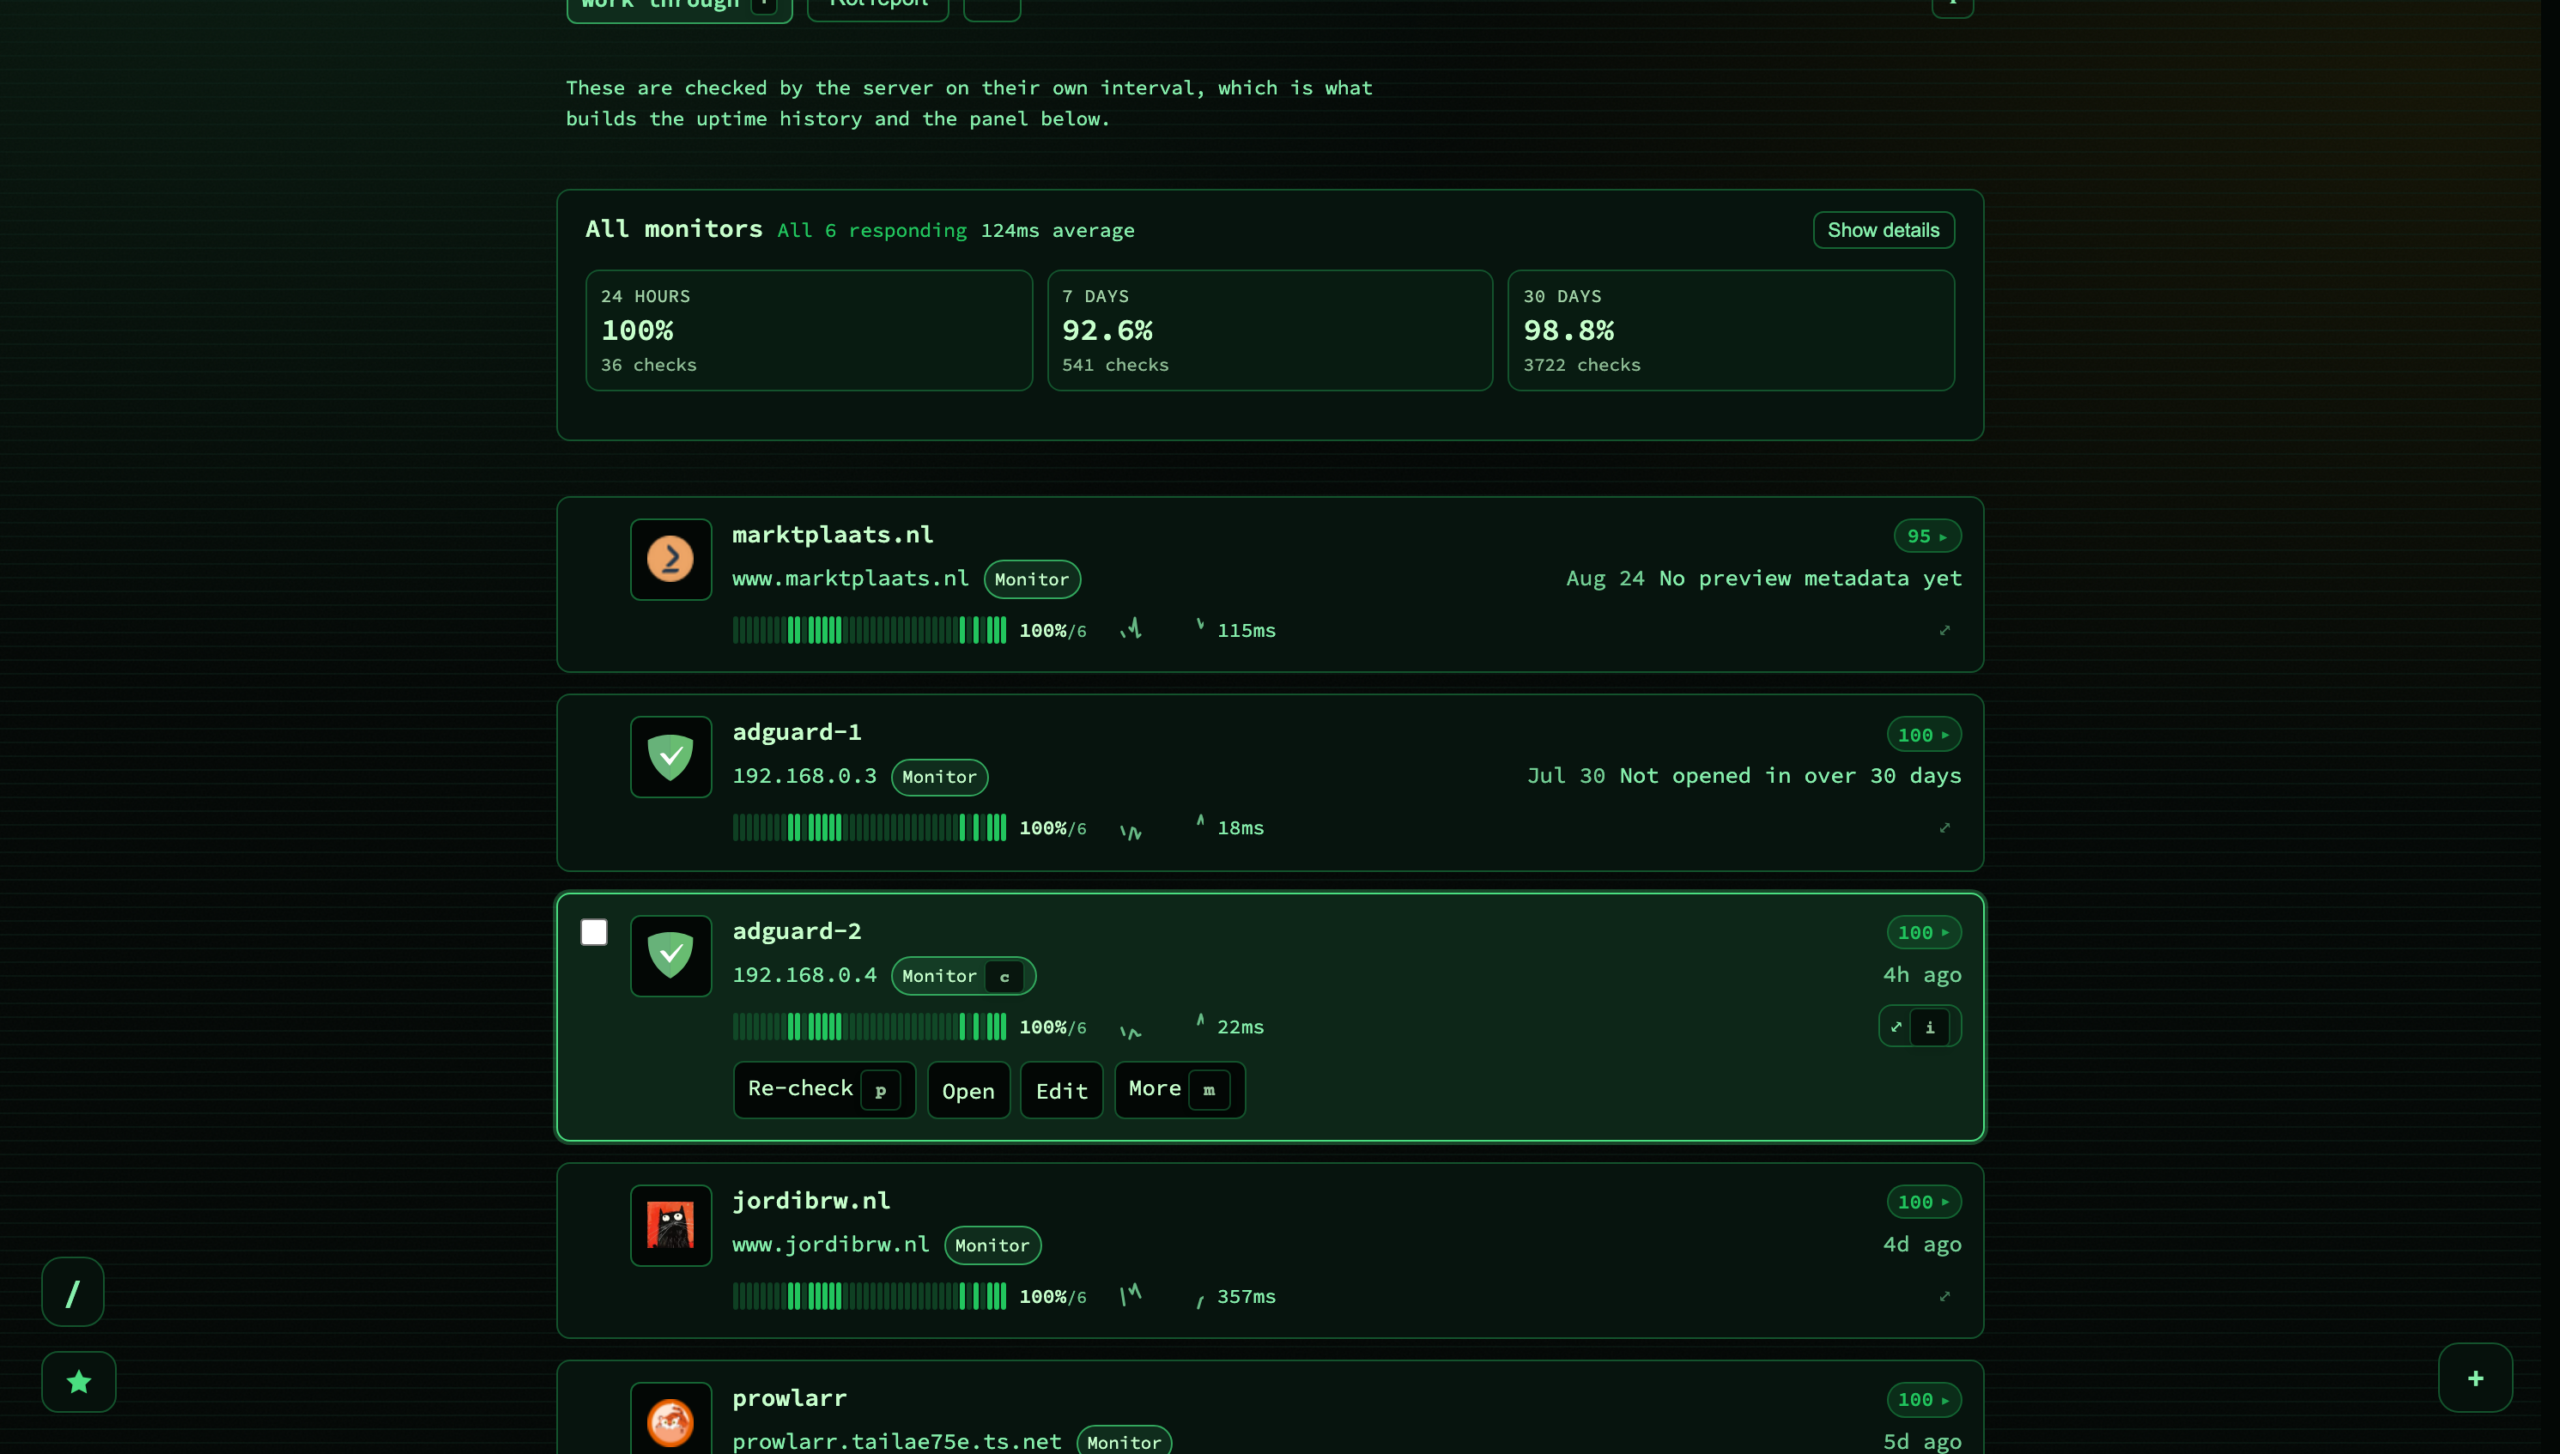
Every uptime percentage is followed by the number of checks behind it
, and that is not pedantry:
100% from three checks
is a far weaker claim than
100% from three hundred
, and a figure that hides its sample size invites you to trust it exactly as much as the strong one. In the same spirit, a window with no samples at all reads
no data
rather than
0%
— a monitor you enabled an hour ago is not a day of downtime — and a window the samples cannot fill says
only 7d of history
instead of quietly computing a thirty-day number over one week of data.
Press
i
, or the
⤢
at the end of the strip, and the same data opens at full size:
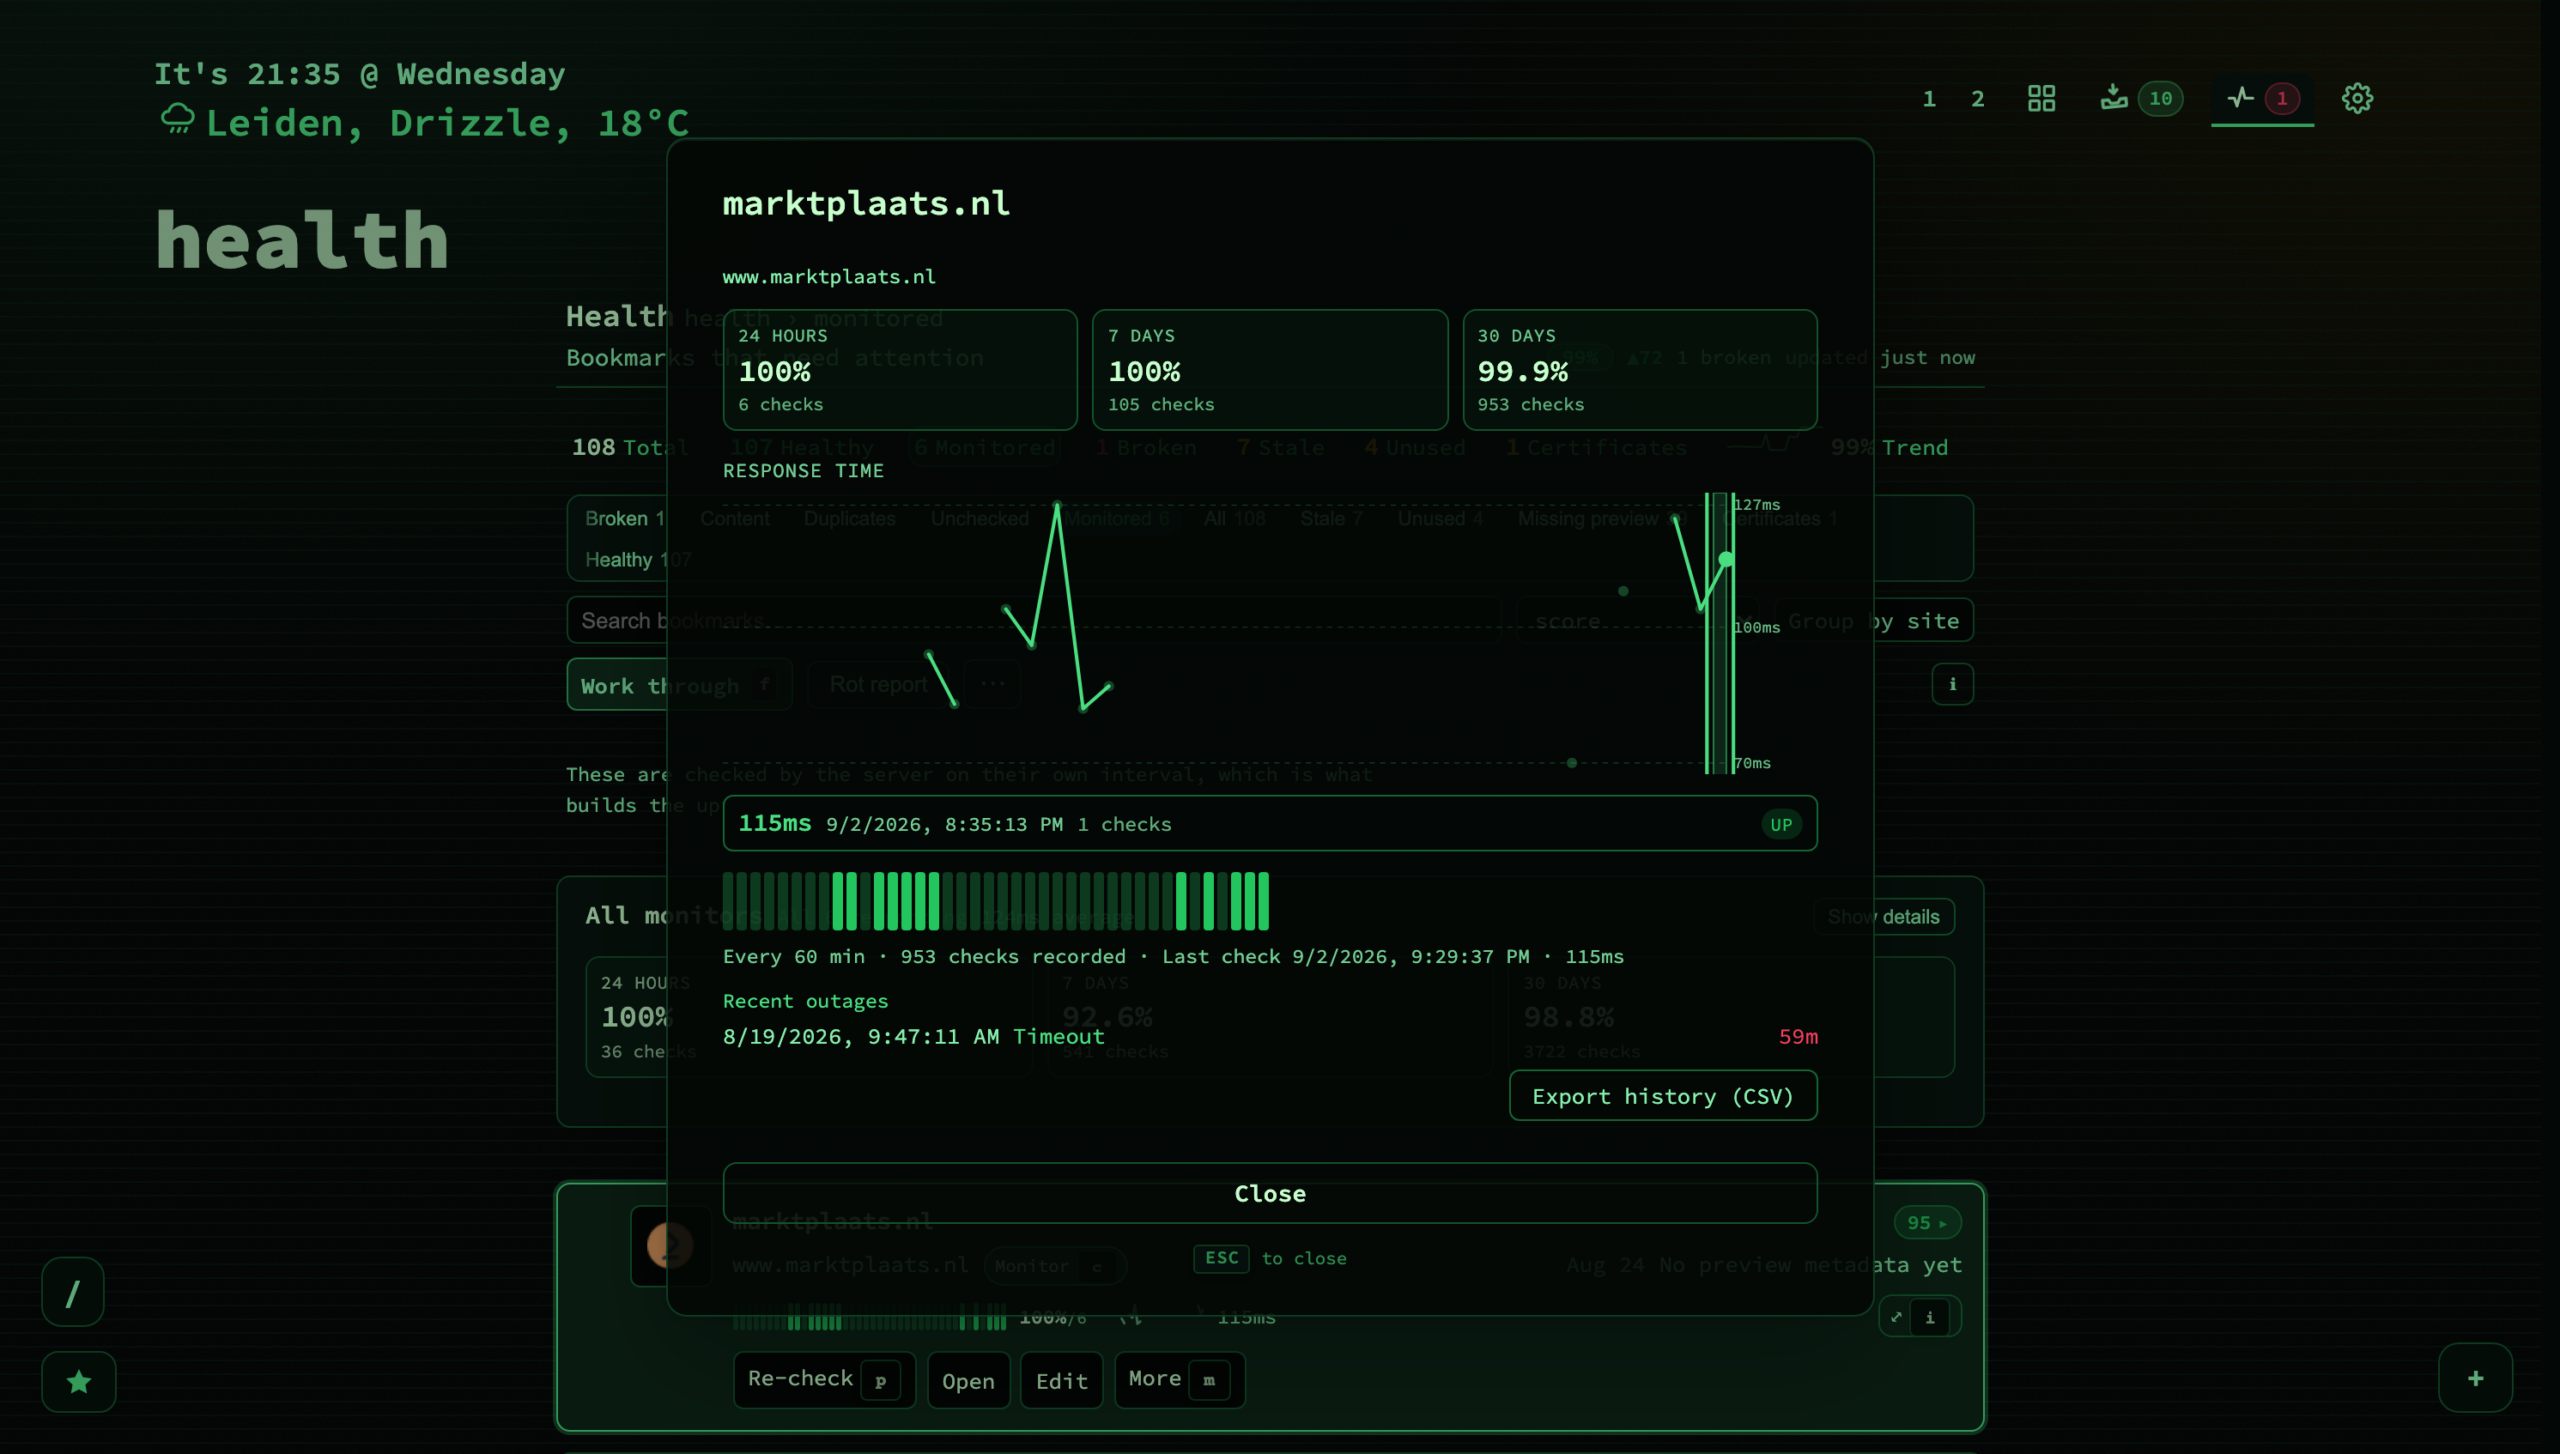
Uptime for 24h, 7d and 30d side by side with the checks behind each; a large response-time chart with min, average and max; a taller heartbeat; the interval and last check; and the full outage list. Nothing is re-fetched — it is the report already on screen — so it opens instantly.
The chart is readable rather than decorative.
Click or hover anywhere in a measurement’s slice of the plot — a full-height column, not a five-pixel dot — and the readout under it names that measurement: the response time, when it was taken, how many checks the point folds together, and whether it was up, down or degraded. It opens on the most recent measurement rather than empty,
←
/
→
walk point to point and skip the buckets with no measurement, and the whole chart is a single
Tab
stop so
Close
stays one
Tab
away.
Every failure records why.
DNS, timeout, refused, TLS, redirect, content, or the HTTP status — stored with the sample and shown in three places at once: the outage list, the timeline, and the
reason
column of the history CSV. The engine always worked this out and then dropped it, so anything that was not an HTTP error used to reach the incident list with a blank reason.
All of them at once
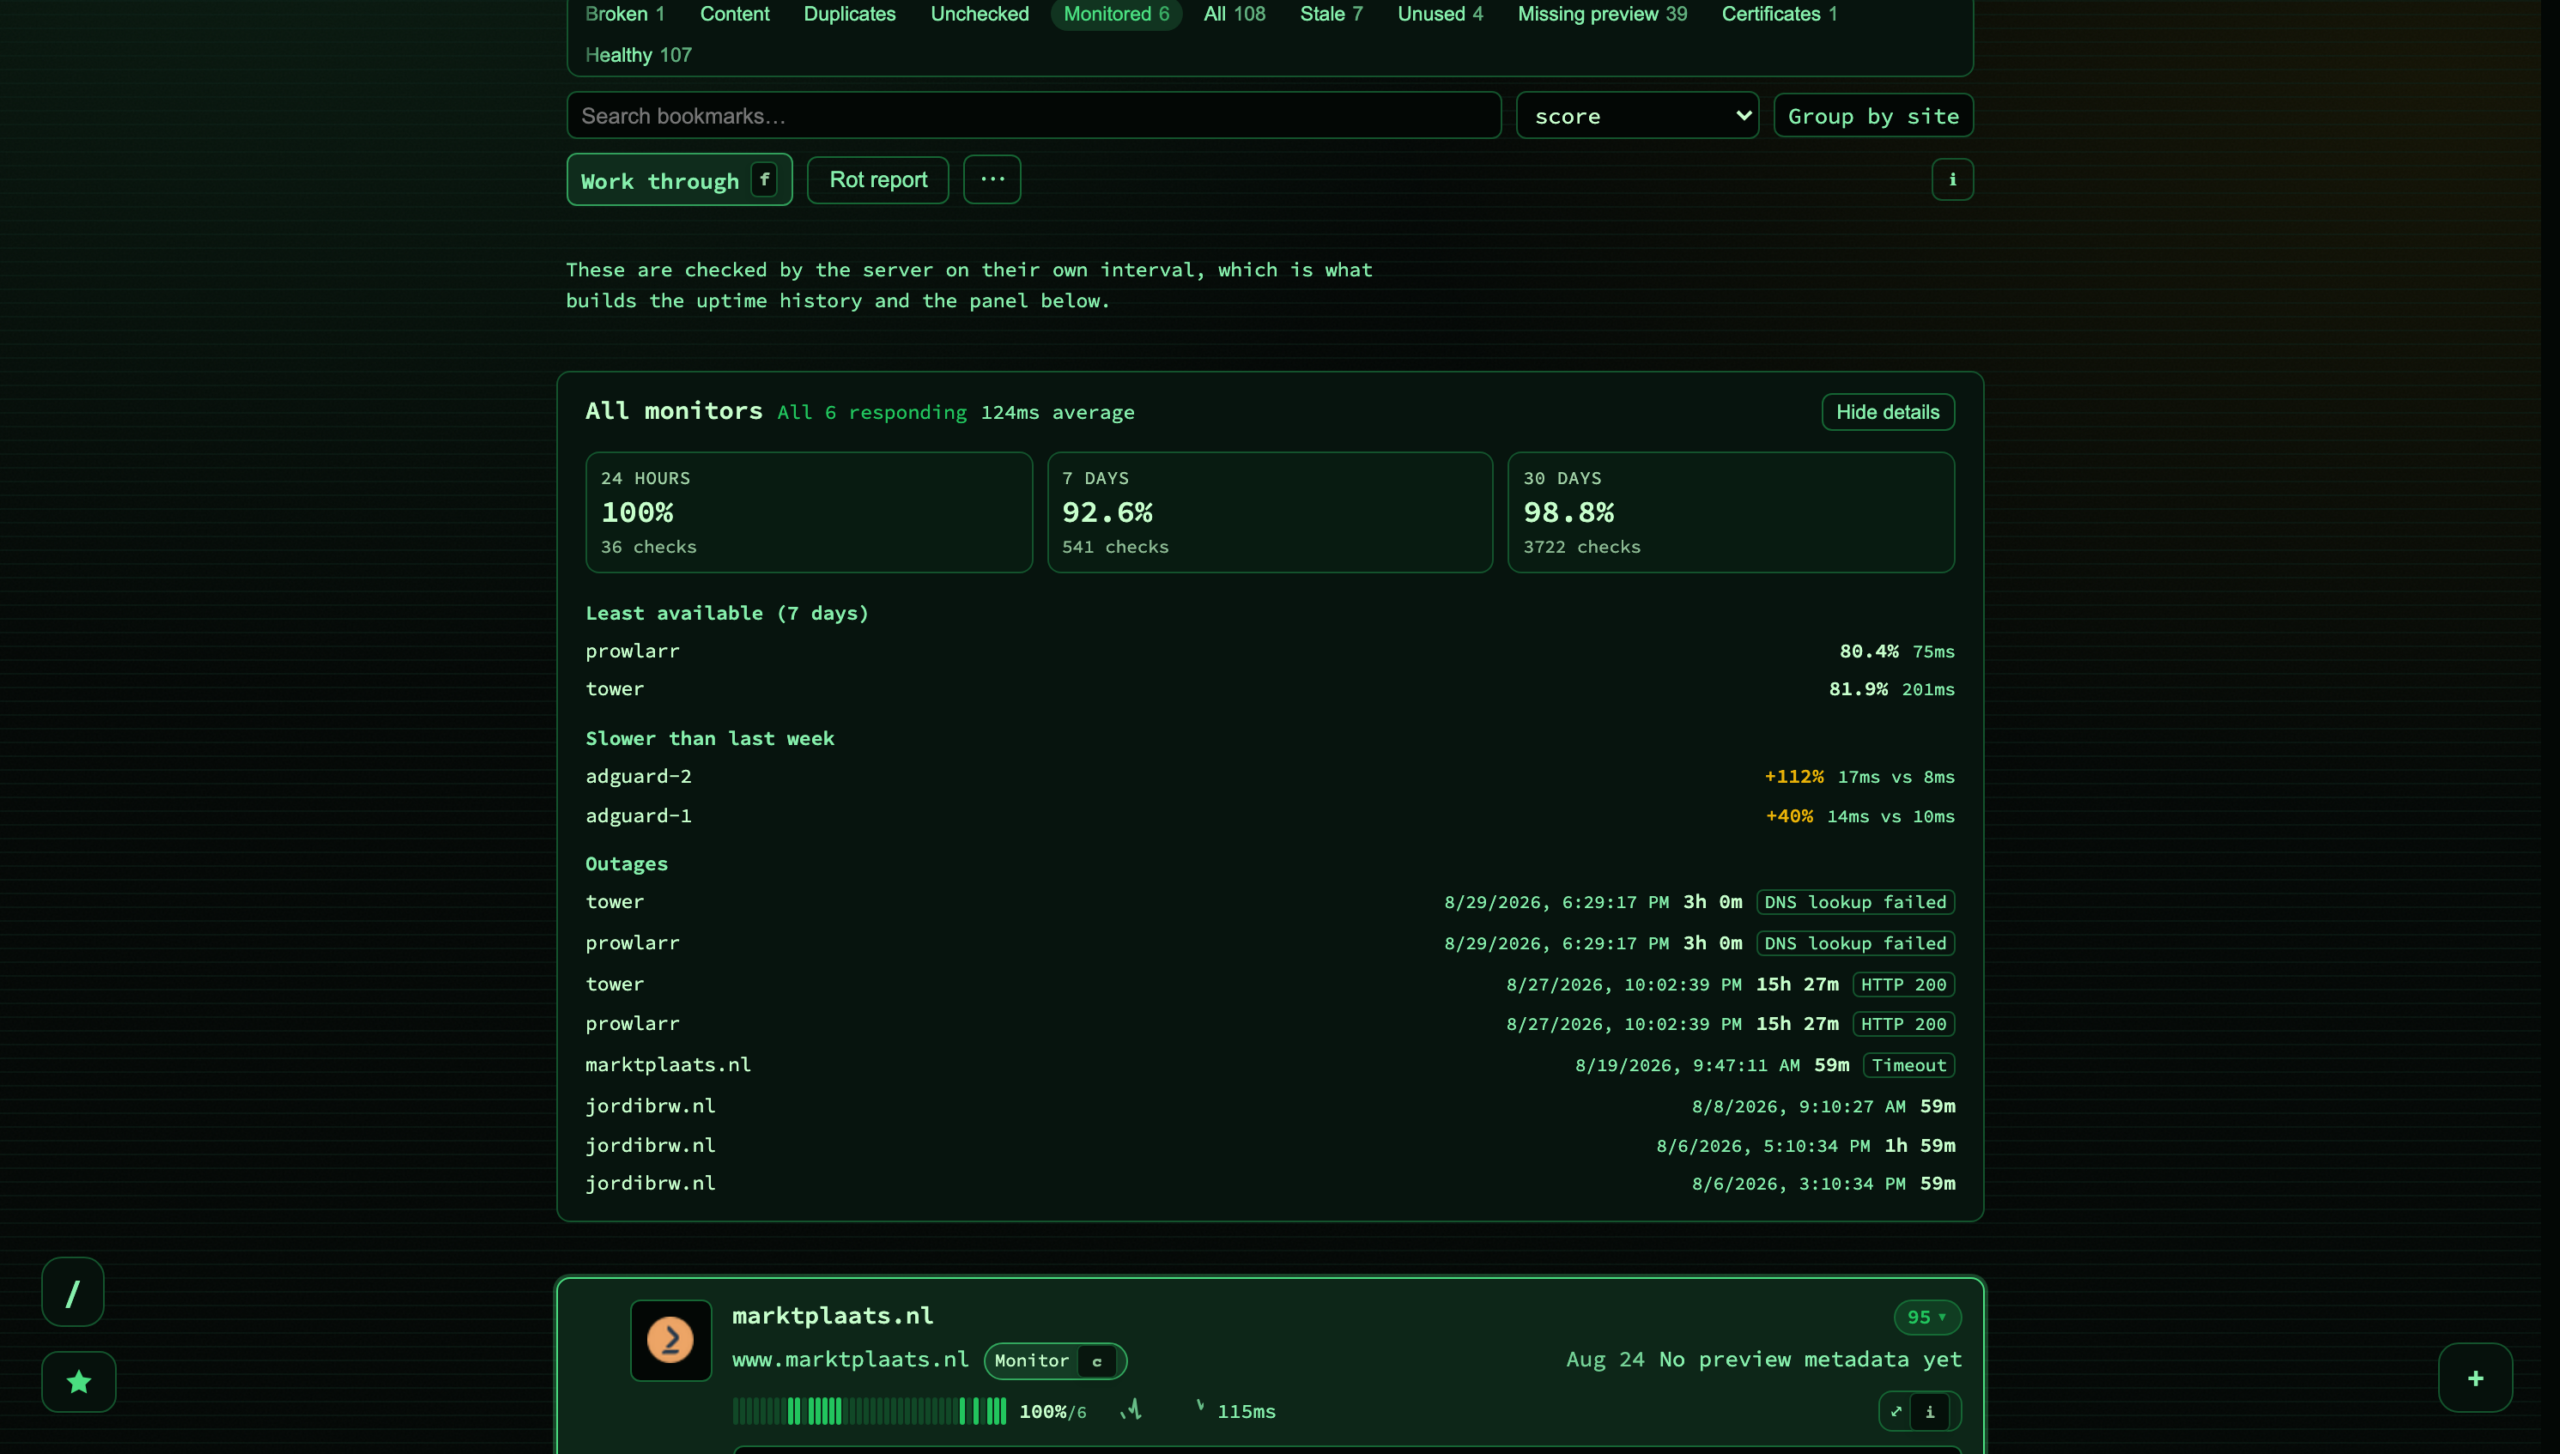
The Monitored filter opens with a panel covering the whole set, which no individual row can:
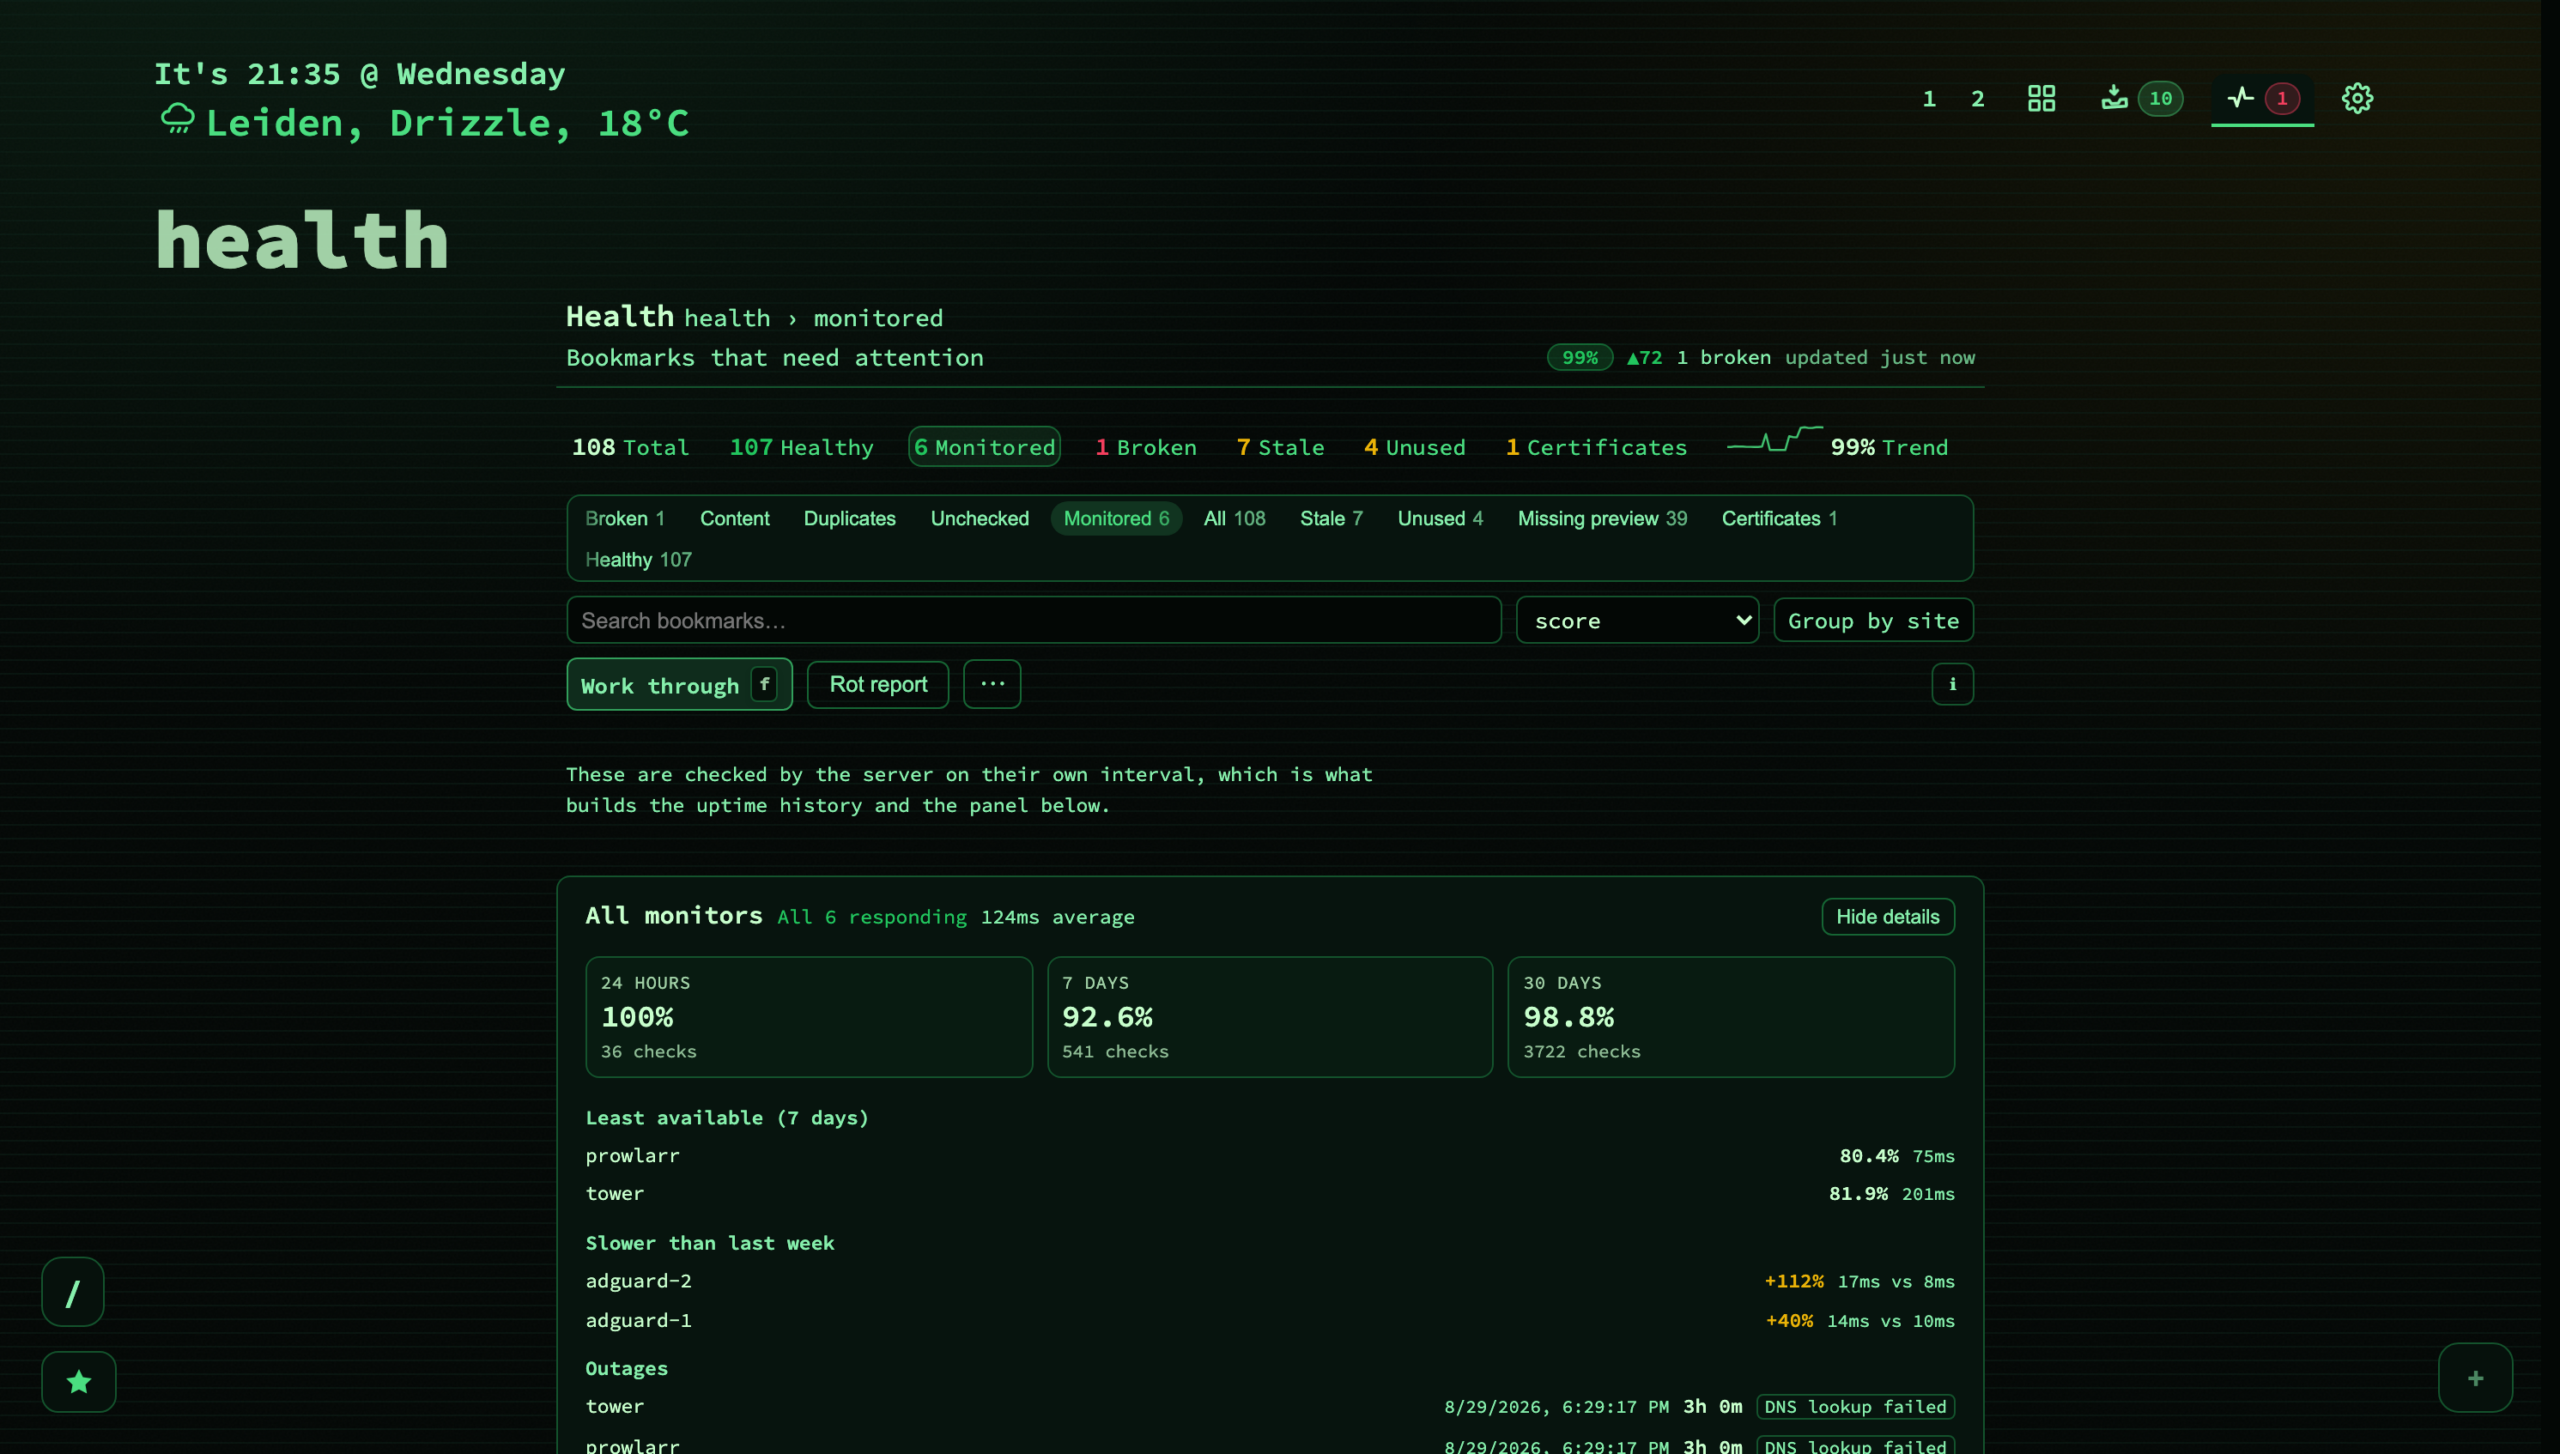
- Pooled uptime over 24h / 7d / 30d, how many monitors are responding right now, and the average response time across all of them. The pooled figure counts individual checks rather than averaging each monitor’s percentage — otherwise a monitor with three recorded checks would weigh as heavily as one with three thousand.
- Least available (7 days) — anything failing now placed first. Monitors at a clean 100% are left out, so a short list means little is wrong rather than that only five were examined.
- Slower than last week — the last day against the seven days before it, meaningful slowdowns only, the two windows never overlapping.
- Outages — every recorded failure across the collection, newest first, each naming its bookmark, with the true total shown when the list is capped.
An empty Monitored list does not say “no issues found”. It explains what monitoring is and how to switch it on, because an empty list here means you have not started , not everything is fine .
Where the numbers live
The report is built on the server and cached for a few minutes, so the header states how old it is rather than letting a headline count read as live. Retest all rebuilds it, and re-tests everything that opted in to checking — up to 250 checks per run, so a large collection takes a second press rather than an unbounded one.
07. Being told about it
Everything so far is a screen you have to open. Two things reach you when you have not.
A webhook , under Config → Behavior → Status & health, posted when a monitored bookmark goes down and again when it recovers. It fires only after N consecutive failures — three by default, adjustable 1 to 10 — so a hiccup stays quiet. Rather than hand-writing a body, pick the service: Slack, Discord, Telegram, Gotify, ntfy, Pushover or Raw JSON for anything else. Each shapes the message the way that service expects and asks only for what it actually needs — Telegram for a chat ID beside the bot URL, Pushover for an application token and user key instead of a URL, since its endpoint is fixed.
Send test alert posts one synthetic failure down the exact path a real one would take. Use it. A mistyped chat ID or a token in the wrong field otherwise fails silently, and the alert you find out about is always the one that never arrived.
Browser notifications
are the same alerts delivered to the browser itself, so they arrive while nextDash is closed — including on a phone. Switch the master setting on, press
Enable on this device
, and allow the permission once per browser; a confirming test notification follows immediately. They need a secure context: Safari and every browser on iPhone and iPad refuse on
http://localhost
, while desktop Chrome, Edge and Firefox allow it. Subscriptions live in
data/push-subscriptions.json
; deleting that file unregisters every device.
Three refinements that only matter once alerts are actually running:
- When many fail at once. One upstream going down takes every bookmark behind it in the same sweep, and a dozen near-identical messages in one second is exactly the pattern Slack and Telegram rate-limit — so the alerts that mattered would be dropped by the service rather than delivered. Past a handful in one round they collapse into a single message naming the first few and counting the rest. Below that the individual messages are kept, because they name the bookmark and its error and are strictly more useful. Certificate warnings are never collapsed, since each names a different host.
- A recovery says how long it was down — X is back online, after 3h 12m . It was the one question a recovery raised and could not answer.
- Maintenance windows. Recurring periods when downtime is expected — a nightly backup, a weekly reboot. Pick the days, a start and an end. Failures inside a window raise no alert and do not count against uptime, but the checks still run and the heartbeat still records what happened, so a real outage that began during maintenance is not hidden. A window whose end is before its start runs past midnight, which is when most maintenance happens, and the row says so rather than looking like a typo.
Muting is per bookmark, and it is not the same as not watching. A personal blog and a critical server used to shout equally loudly, and the only way to quieten the first was to stop monitoring it — which also stopped recording it. A muted bookmark is still checked, its history still builds, and the row still reads as down when it is down, carrying a Muted badge so it can never be mistaken for one that should have raised the alarm and did not. Mute alerts and Unmute also sit in the health selection bar, because twelve bookmarks behind one outage should not mean twelve dialogs.
08. Certificates, at no cost
Every HTTPS check already completes a TLS handshake, so the expiry date is read from it. There is no extra request and nothing to switch on.
It is recorded from every check, not only from the monitor sweep — periodic checks, a Retest all and a single on-demand check all contribute — so an install that never switched a bookmark to Monitor still gets warnings. A Certificates tile appears once something is close, affected rows carry a badge with the days left, and warnings go out at 30, 7 and 3 days through the same webhook and push notifications as downtime. Three thresholds rather than a countdown, because the useful signals are plan the renewal , do it this week and this breaks now ; a daily reminder for a month is noise that teaches people to ignore the badge.
Certificates belong to a host , not a bookmark, so ten bookmarks on one domain all show the badge and one renewal clears all ten. The tile counts in hosts and clicking it lists the bookmarks on them.
09. Working through it — which is the actual point
A list of problems is not the same thing as fewer problems, and this is where most link checkers stop.
Filter to
Broken
and you know what is wrong; every fix then costs the same three moves — find the row again after the list re-renders, aim at its action, decide.
Work through
in the toolbar, or
f
, removes two of the three: one row on screen at a time, its actions large, the rest of the page out of the way.
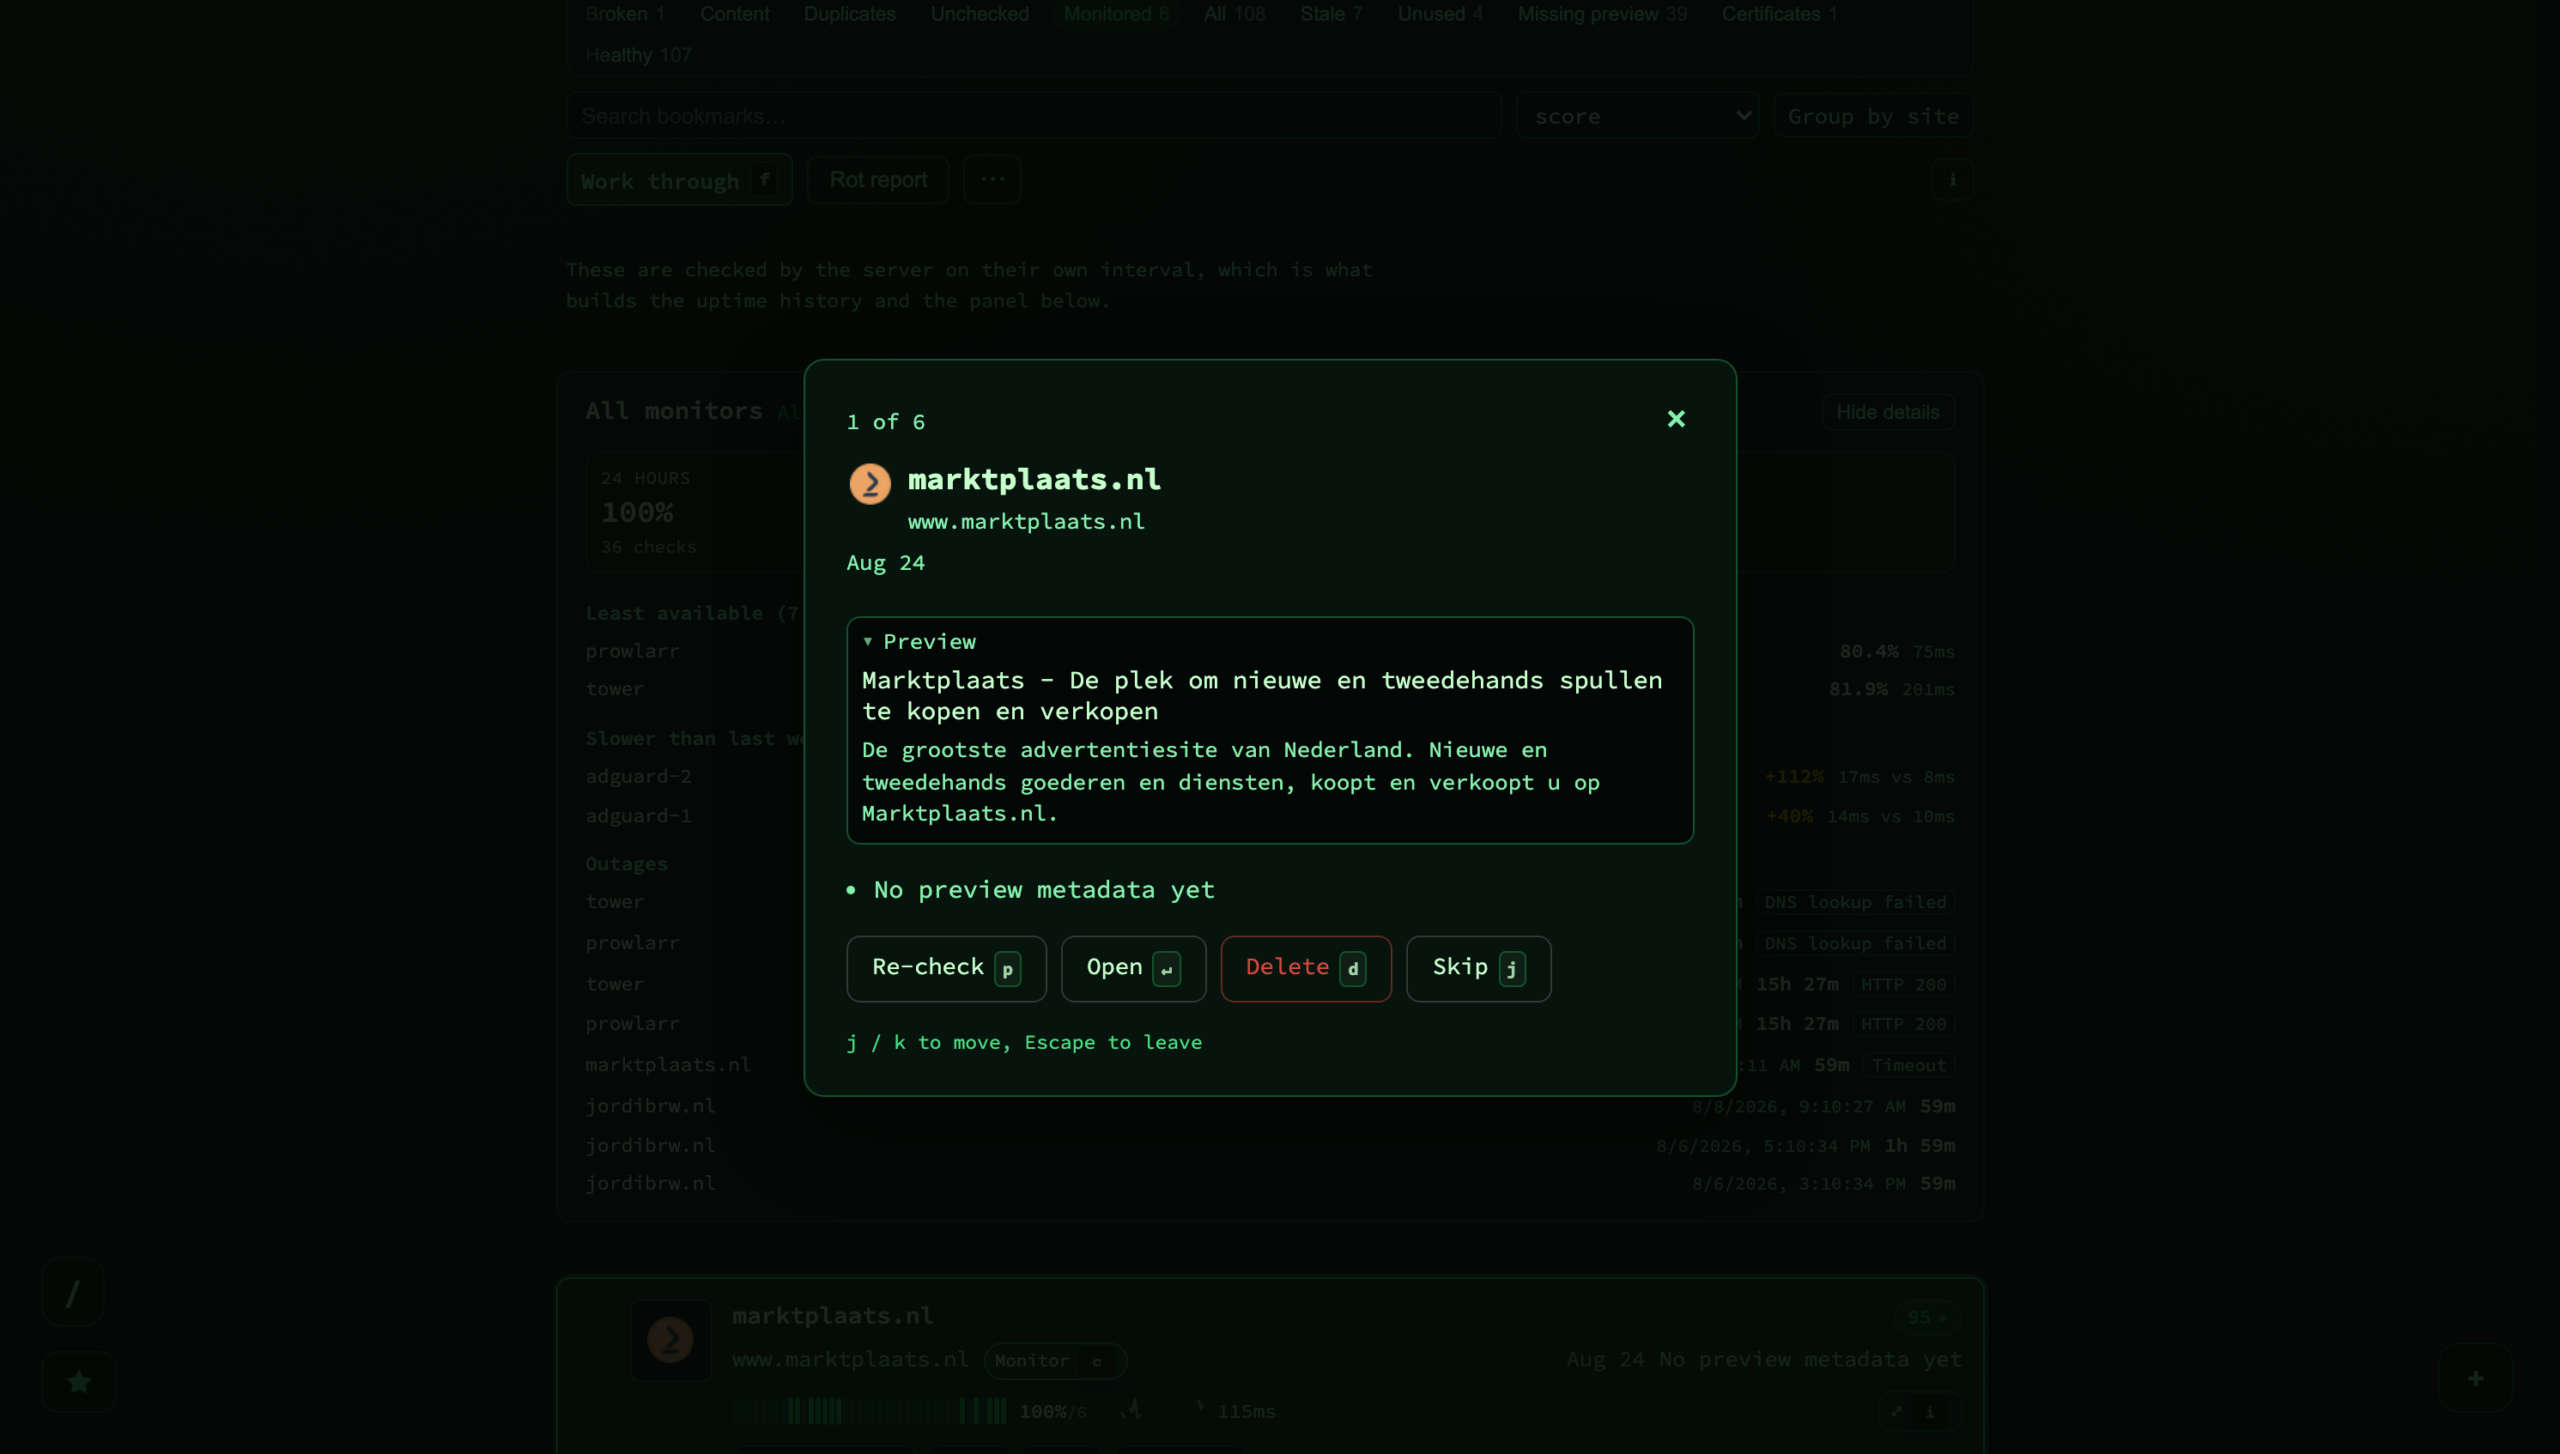
Re-check
(
p
),
Open
(
Enter
),
Delete
(
d
),
Skip
(
j
), and
k
to go back. It starts on the row your cursor was on rather than at the top, because the way in is usually
I am looking at this one
.
Esc
leaves and puts the cursor on the row you had reached, so dipping in for three fixes and back out is not a mode switch. It is the same list and the same actions throughout — nothing is available only here — and stepping past either end says so rather than quietly wrapping round.
Ten links, two minutes. When enough links want attention, a card appears in the bottom-left corner of the dashboard naming what is waiting — “10 links to review: 4 broken, 3 never opened, 3 not opened in a year” — and Start opens Health and runs a session over the worst ten. A session ends : it says how many you dealt with, offers Another ten when more are waiting, and Done for today puts the offer away until tomorrow. Bounded and finishable is the whole idea — a number that never reaches zero is one people learn to ignore. Skipping is not handling, so the count at the end is honest, and below five waiting links the card stays quiet.
The rest of the repair kit:
| Set aside one condition |
n
or
z
on a row. A link you have looked at and judged fine stops raising
that
flag — and only that one. It stays in the collection, stays checked, and an
Ignored
filter lists everything set aside so nothing disappears without a way back
|
| Follow redirects in bulk | Select rows, ask each one where it now goes, review the answers, apply after one confirmation. A domain move breaks twenty bookmarks with the same redirect. The server pings each replacement before storing it, so a row that still fails is reported as such rather than reported as fixed |
| Find in Web Archive | Opens the calendar of captures, or asks the archive for the closest one, says when it was taken, and offers to point the bookmark at it — appending the original address to the note, so nothing is lost |
| Bulk bar | Set checking, re-check, mute, open, copy links, tag, delete — the same bar, in the same place, that Config → Bookmarks has. Deletes go to the trash, and a row that changed since the report was built is skipped and reported rather than deleted |
| Three slow jobs on a selection | Rebuild previews, refresh favicons, save a local copy of each page. One request at a time behind a counting bar — twenty simultaneous requests from one client is a burst a small server reads as an attack |
And the other half of rot: having a copy. Everything above is diagnosis. Archive new bookmarks submits each new link to the Web Archive on the day you save it, and Local copies saves a whole page — text, styling and images — as a single file in your data directory through monolith , which the container ships with. A capture that fails names the reason, and a page that saved as an empty shell — one that builds itself in the browser, so what was stored is a script and nothing to read — says so on the row. That one matters most: an empty capture looks exactly like a good one until the day you need it, which is the day the original went away.
10. Drift, the rot report, and the shape of the whole thing
Drift is the failure mode a status code cannot catch: the page answers, and it is not the page any more. A rebrand, a docs reorganisation, a redirect to a new domain. Turn it on per bookmark with Watch for redirects, retitling and rewrites , and changes are reported against the version you saved.
A drift finding is a prompt, not a verdict. The same rebrand trips drift on every bookmark pointing at that site at once, and all of them are fine. Tick those rows and use Accept drift in the bulk bar — it appears only when the selection actually holds findings, and counts just those. Accepting does two things in one write: it clears the finding and drops the baseline it was measured against, so the next check records the page as it is today. Clearing only the finding would be useless — the stored baseline still describes the page as it was before the change, so the identical drift would be reported again on the very next check. Note what accepting asserts: that the new page is the right one. That is why there is no accept everything , and why the rows are always ones you picked.
The rot report is a button in the toolbar, and it is the once-a-month read to the view’s daily work queue:
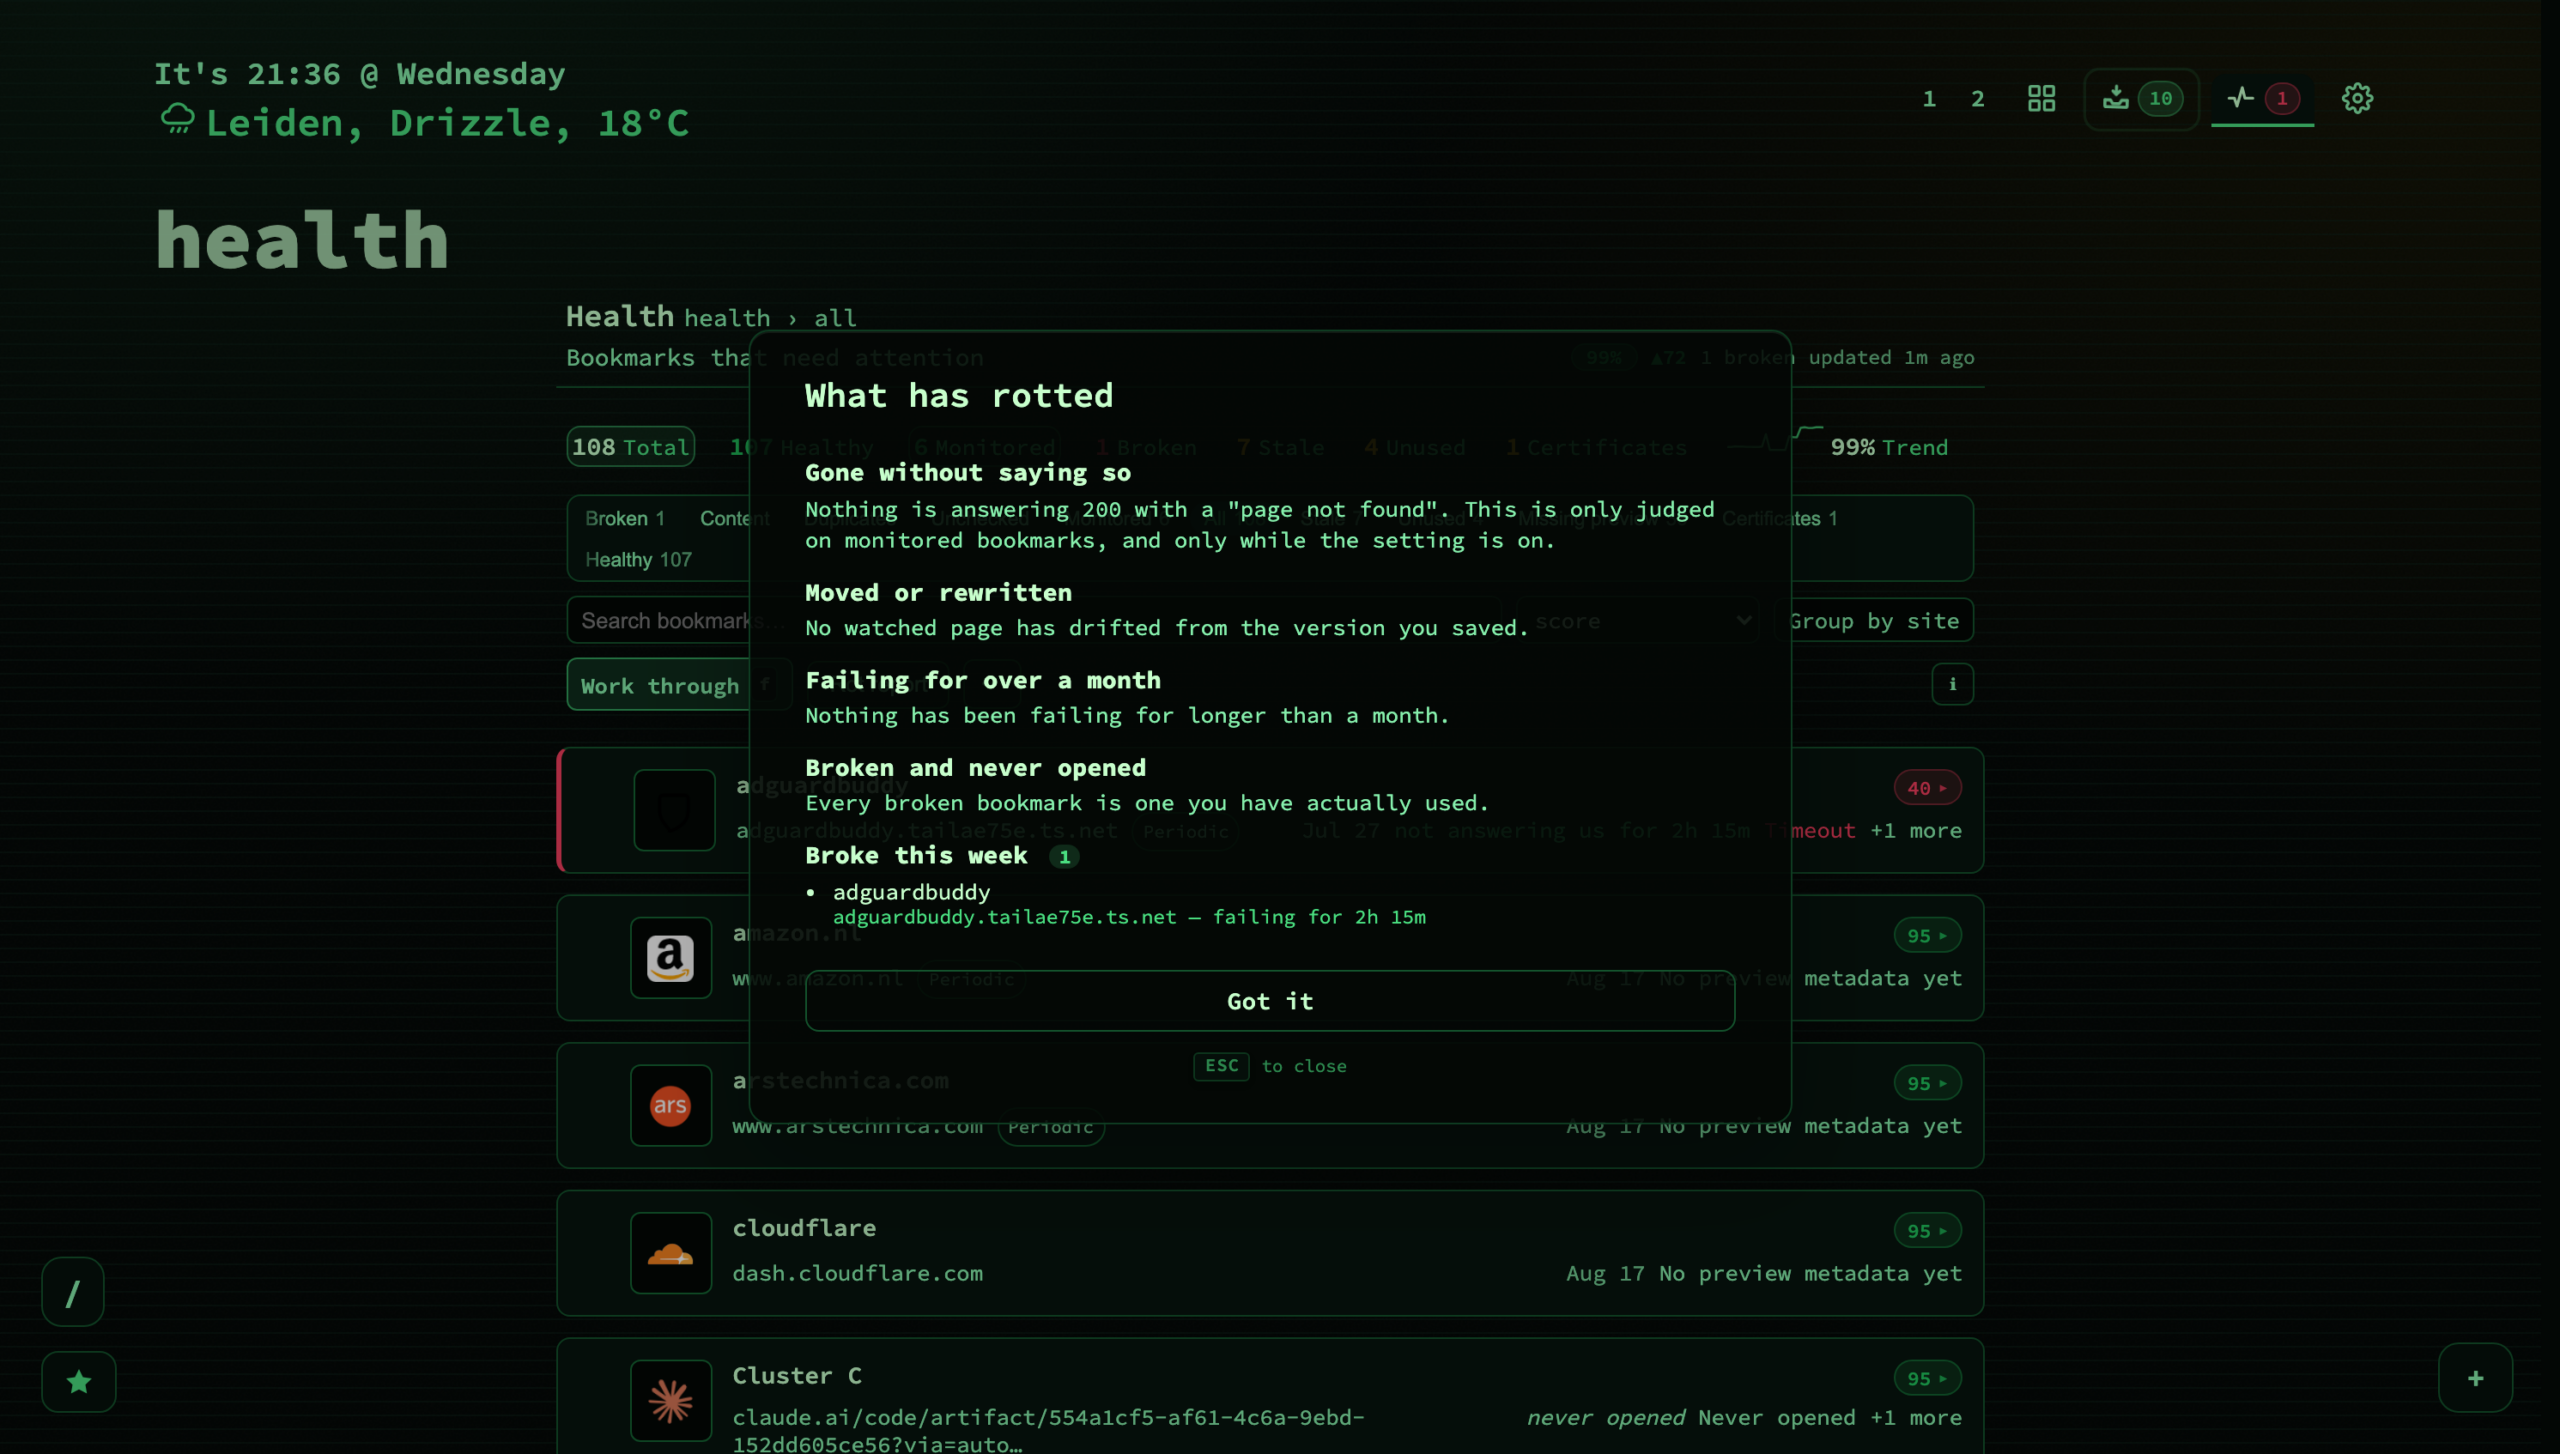
Five questions with the rows behind each: what has gone without saying so, what has moved or been rewritten, what has been failing for over a month, what is broken and was never opened, and what broke this week. A section with nothing in it says so in a sentence — “Every broken bookmark is one you have actually used” is a finding, not an empty state.
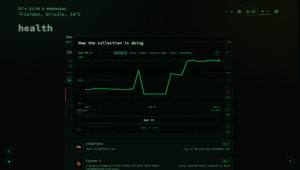
And the collection over time. The tile row carries a sparkline with the current reading; click it, or the ▲/▼ beside the percentage in the header, for the full chart:
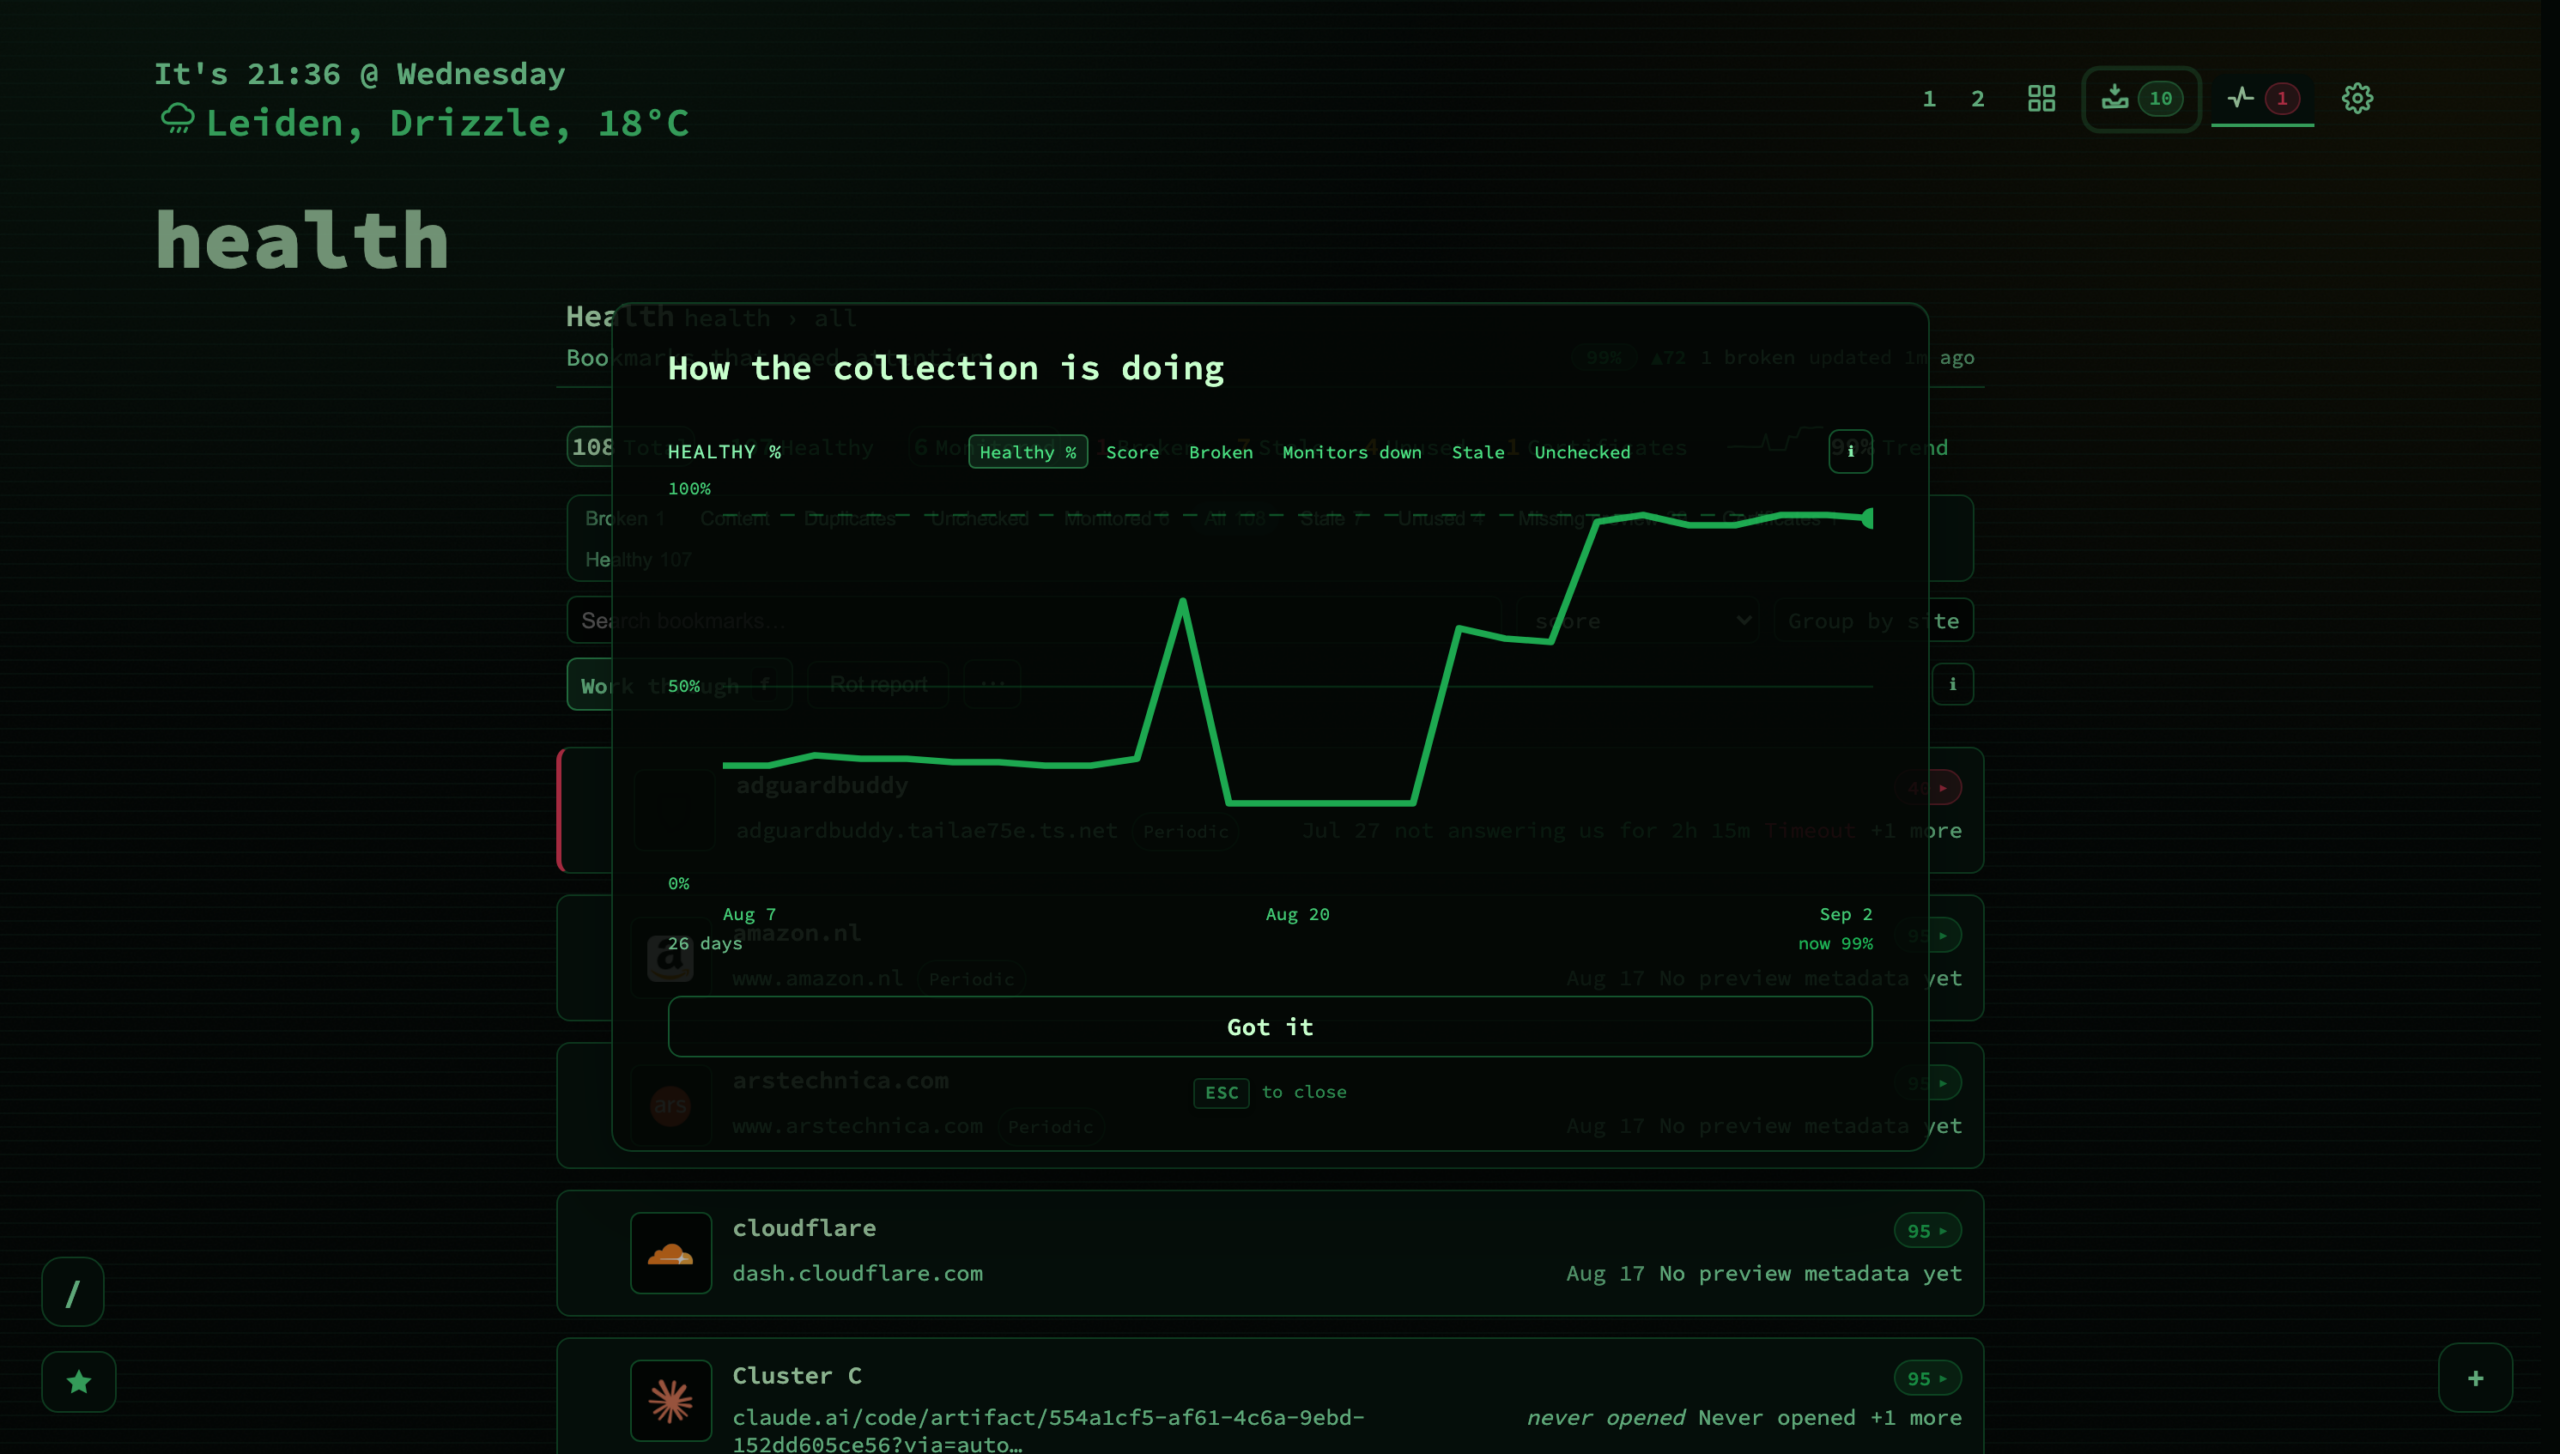
One point per day for ninety days, over nine counters, with a row of buttons for Healthy % , Score , Broken , Monitors down , Stale and Unchecked . Percentages keep a fixed 0–100 axis, so a collection sitting between 91% and 93% looks as flat as it actually is; counts get an axis scaled to the window. Point at a day to read out its date and its reading, and a day with no reading says so rather than showing 0% — days you did not open the dashboard leave a gap rather than a straight line drawn through them , because a line through them would be an invention. Nothing appears at all until there are two days to compare.
11. Getting it out again
| Export | The current filter and search as CSV — name, URL, status, score, page, category, last checked, and the same issue wording the score panel shows. When the exported list holds monitored bookmarks it also carries interval, the three uptime windows, last response time and total checks — but only then, since otherwise they would be six empty columns on every line |
| Export history | On the Monitored filter: one row per individual check, with its timestamp, up or down, ping time, HTTP status and cause. Export gives you the current state; this gives you the record over time |
| Deep links |
?hv_filter=broken#health
,
?hv_id=1:4#health
to land on one row,
?hv_sort=
,
?hv_q=
,
?hv_refresh=1
|
| Commands |
:health [filter]
,
:health page [n]
,
:monitor
,
:monitor on
,
:monitor off
,
:goto health
|
| Endpoints |
GET /api/bookmark-health
,
?view=facts
for the badge’s twelve counts,
GET /api/health/trend
|
Uptime is written as a plain number so a spreadsheet can average the column, and a window with no samples stays
blank
rather than becoming a
0
that would read as total downtime. Values starting
=
+
-
@
are prefixed so a spreadsheet treats them as text rather than formulas, and a UTF-8 BOM keeps accented titles intact in Excel.
12. So — is it hard to set up?
The honest answer is that it depends entirely on which half you want, and the two halves are very far apart.
The cleanup half is already on.
Duplicates, shortcut conflicts, missing previews, stale, unused, the score, the trend, the rot report, work-through sessions: open
/#health
and it is all there, on a fresh install, with nothing configured. If that is all you ever use, the setup time is zero and the ongoing cost is zero — nothing reaches the network.
Availability checking is one keystroke per bookmark , and a single button for a filtered group. There is no server to install, no agent, no second container and no account. Realistically:
-
Open Health. The first visit runs a
six-step walkthrough
built around one worked example — a self-hosted status page behind a login, backed up nightly — rather than listing settings in the abstract. It covers turning on Monitor and picking an interval, saying what
up
means with status codes
200,401and a keyword, watching for drift, excluding the nightly backup with a maintenance window, and wiring up an alert with a test send. It appears once; you can ask for it again from Config → Behavior → General. - Filter to something narrow — a page, a category, a search — and use the bulk button to set those rows to Periodic . That is breakage detection for the whole collection, done.
-
Press
cand choose Monitor on the handful of things you would actually want to know about within the hour. Six is a normal number here. Two hundred is not. - If any of those are self-hosted, raise the check timeout past three seconds and, if they sit behind a login, add one health sign-in and point the rows at it by name.
- Only if you want to be told while nextDash is closed: pick a notification preset, set alert after 3 , and send the test .
Steps 1 to 3 are a couple of minutes. Step 4 is the one that trips people up on a home server, and step 5 is the only part that involves a service outside nextDash at all.
What it costs to run. One request per monitored bookmark per interval. Six bookmarks at fifteen minutes is 576 requests a day, which is nothing, and the samples behind it are thirty days of small JSON in your data directory. Periodic bookmarks are about a check a day each. Off bookmarks cost nothing, because nothing happens to them.
The thing not to do is switch everything to Monitor. There is no button for it, on purpose. Monitoring two hundred bookmarks at five-minute intervals is 57,600 requests a day aimed at other people’s servers, and what you get for it is a wall of red on the days a news site rate-limits you. Six things you would get out of bed for, everything else on Periodic, is the shape that works.
At a glance
| Open it |
Heartbeat icon ·
Shift+H
·
:health
·
/#health
|
| Needs no setup | Score, duplicates, shortcut conflicts, missing previews, stale, unused, trend, rot report, work-through |
| Checking modes | Off (default) · Periodic (~daily) · Monitor (own interval, keeps history) |
| Monitor intervals | 5m · 15m (default) · 30m · 1h · 6h · 24h |
| History | 30 days of checks · 90 days of daily points · report cached a few minutes |
| Check timeout | 3s default; 5 / 10 / 15 / 30 offered, clamped 2–30 |
| Score | broken −60 · duplicate −15 · shortcut conflict −15 · never checked −10 · stale check −5 · no preview −5 · usage free |
| Expected response | Keyword (or fail-if-present) · status codes · alternate address · stored sign-in · drift · mute |
| Alerts | Slack · Discord · Telegram · Gotify · ntfy · Pushover · Raw JSON · browser push · after 3 failures by default |
| Certificates | Read from the handshake · warnings at 30 / 7 / 3 days · per host |
| Keyboard |
j
/
k
move ·
s
score ·
i
statistics ·
p
re-check ·
c
checking ·
f
work through ·
x
select ·
m
more ·
n
/
z
ignore ·
R
reload
|
| Export | Current filter as CSV · per-check history CSV on Monitored |
| Files |
data/health-cache.json
·
data/health-history.json
·
data/health-trend.json
·
data/health-credentials.json
(
0600
)
|
| As of | v1.4.6 (2 September 2026) |
Where to go next
- The manual — Status monitoring and health
- Full changelog — CHANGELOG.md
- Install and self-host — github.com/jordibrouwer/nextdash
Tags: nextdash, health, monitoring, uptime, link rot, self-hosted, bookmarks