nextDash v1.29.2 — response-time trends and cleaner titles
nextDash v1.29.2 draws the response time of network checks, cleans login words off suggested bookmark titles and opens the digest with a short summary.
Response time on network checks
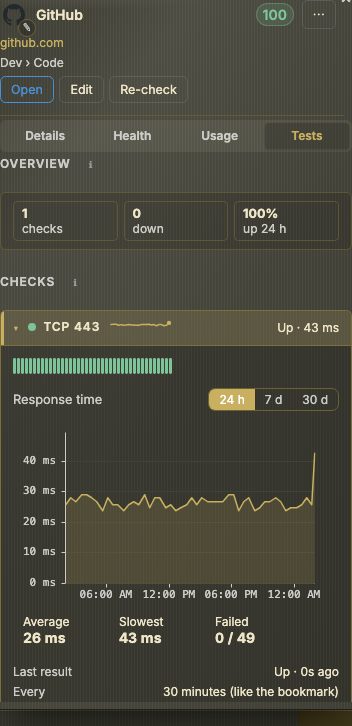
A check that measures milliseconds (TCP, Ping, DNS, HTTP detail and JSON) now shows its last day as a small line in the Tests tab, in the Network tests widget and on the bookmark’s preview card.
Open a check in the Tests tab to see its response time over 24 h, 7 d or 30 d. The slow limit is a dashed line, and failed checks are marked along the bottom. The first check with a trend opens on its chart by itself. Nothing new is stored: the chart reads the history the checks already keep.
Cleaner page titles
When the form suggests a name for a new bookmark, a leading Login – or Sign in | and the site’s own name at the end, as in – YouTube, are taken off. A small turned arrow at the end of the name field brings the page’s own title back, and another press the cleaned one. It shows only for a name nextDash chose and you have not touched.
The digest in plain sentences
The weekly digest window opens with a few sentences on the week, built from the same figures as the cards below them.
Smaller changes
- The news badge of a watched feed stays, calm and clickable, until the news is read. The news window is one hour by default; it was 30 minutes.
- Inbox rows that load late still rise in.
Upgrading
docker pull ghcr.io/jordibrouwer/nextdash:latest
# or
docker pull foobar1452/nextdash:latest
On Unraid, update the container from the Docker tab. Full notes are in the GitHub Release.