nextDash v1.28.0 — network tests on every bookmark
nextDash v1.28.0 lets a bookmark test its own service. A new Tests tab checks a port, a ping, DNS records, a certificate, an HTTP answer or a JSON value, once or on a schedule, and the results show up wherever you look.
A Tests tab on every bookmark
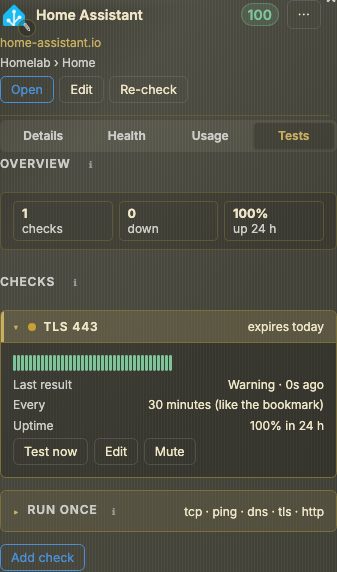
Open a bookmark in the Bookmarks view and its side panel now has a fourth tab, Tests (press 4). Tiles give the checks, how many are down and the uptime over 24 hours; each check opens to its schedule, last result and uptime strip.
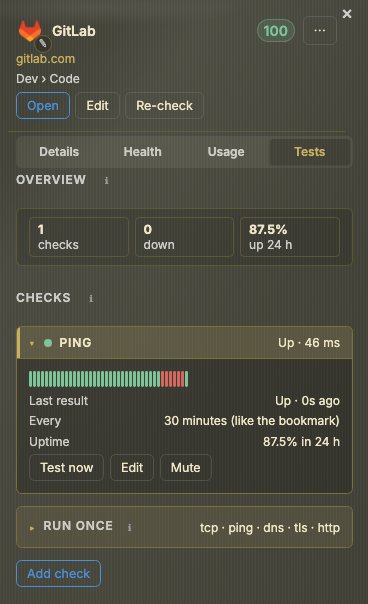
A bookmark can carry up to six checks, of six kinds:
- TCP: does the port connect, and how fast.
- Ping: 1 to 10 echoes, down from a loss you set.
- DNS: A, AAAA, CNAME, MX, TXT, NS or CAA records, with an optional expected value.
- TLS: the certificate chain, version and days left, with a Warning from a number of days you choose.
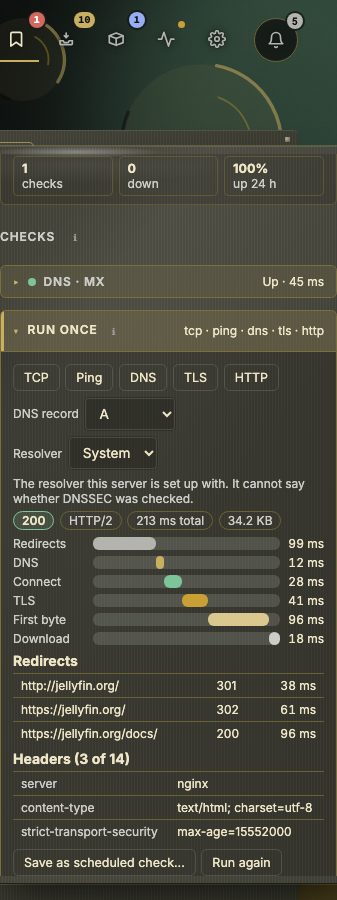
- HTTP detail: one GET with a timing bar per phase, redirects and headers.
- JSON: one value in an answer, compared with what you expect.
Run once, or schedule it
Run once sends one test from the server right now, saving and alerting nothing. Save as scheduled check… turns what you just tested into a check.
Add check walks through three steps: the type, what to check, and planning and alerts. Test first runs the form once before you save. A check runs on the bookmark’s schedule or its own (5 minutes to 24 hours) and uses the bookmark’s retries, quiet hours and maintenance windows.
DNS checks also notice changes. The first run stores the records; a later, different set shows as DNS changed with the difference, and the bell offers Accept. A and AAAA records, which rotate behind a CDN, are left out by default.
Checks where you work
A bookmark row on the dashboard shows its checks as chips beside the tags. By default only a check with a problem shows; Config → Monitoring → Checks switches that to Always or Never. A click on a chip opens the Tests tab.
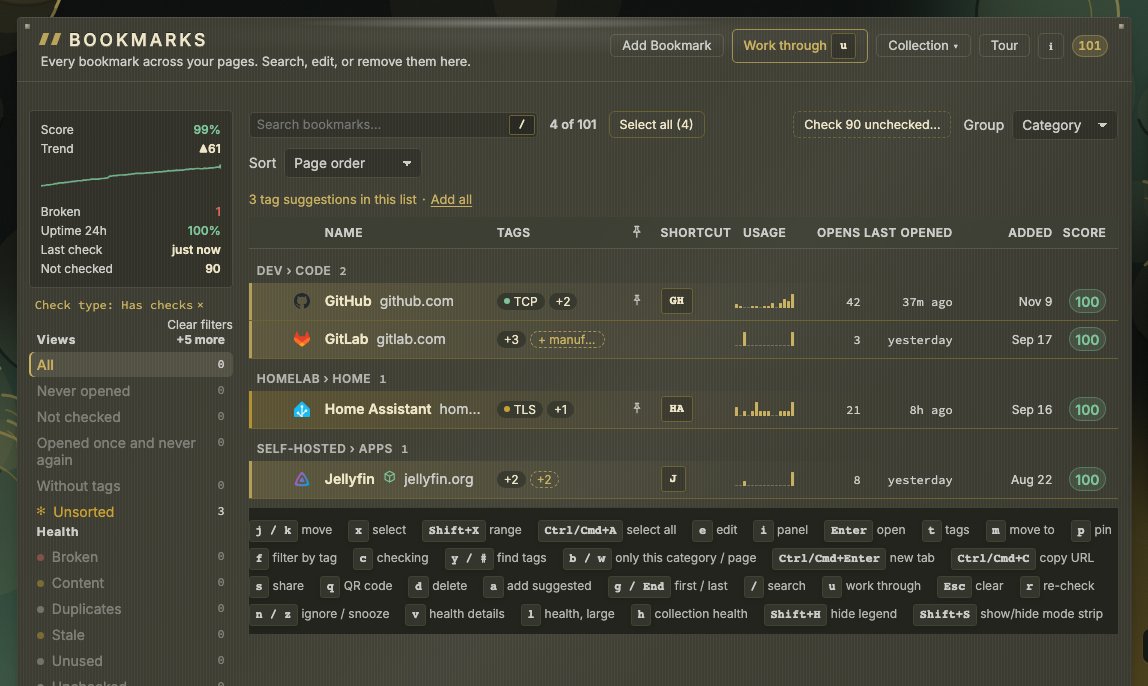
A check that is down sits in the bell, the status page can list a service’s checks, and a new Network tests widget shows them as rows, tiles or a heartbeat. MCP clients get five tools, off by default.
Settings and safety
Config → Monitoring → Checks has a Network checks panel with the master switch, the ping mode, a limit on scheduled checks and a table of every check.
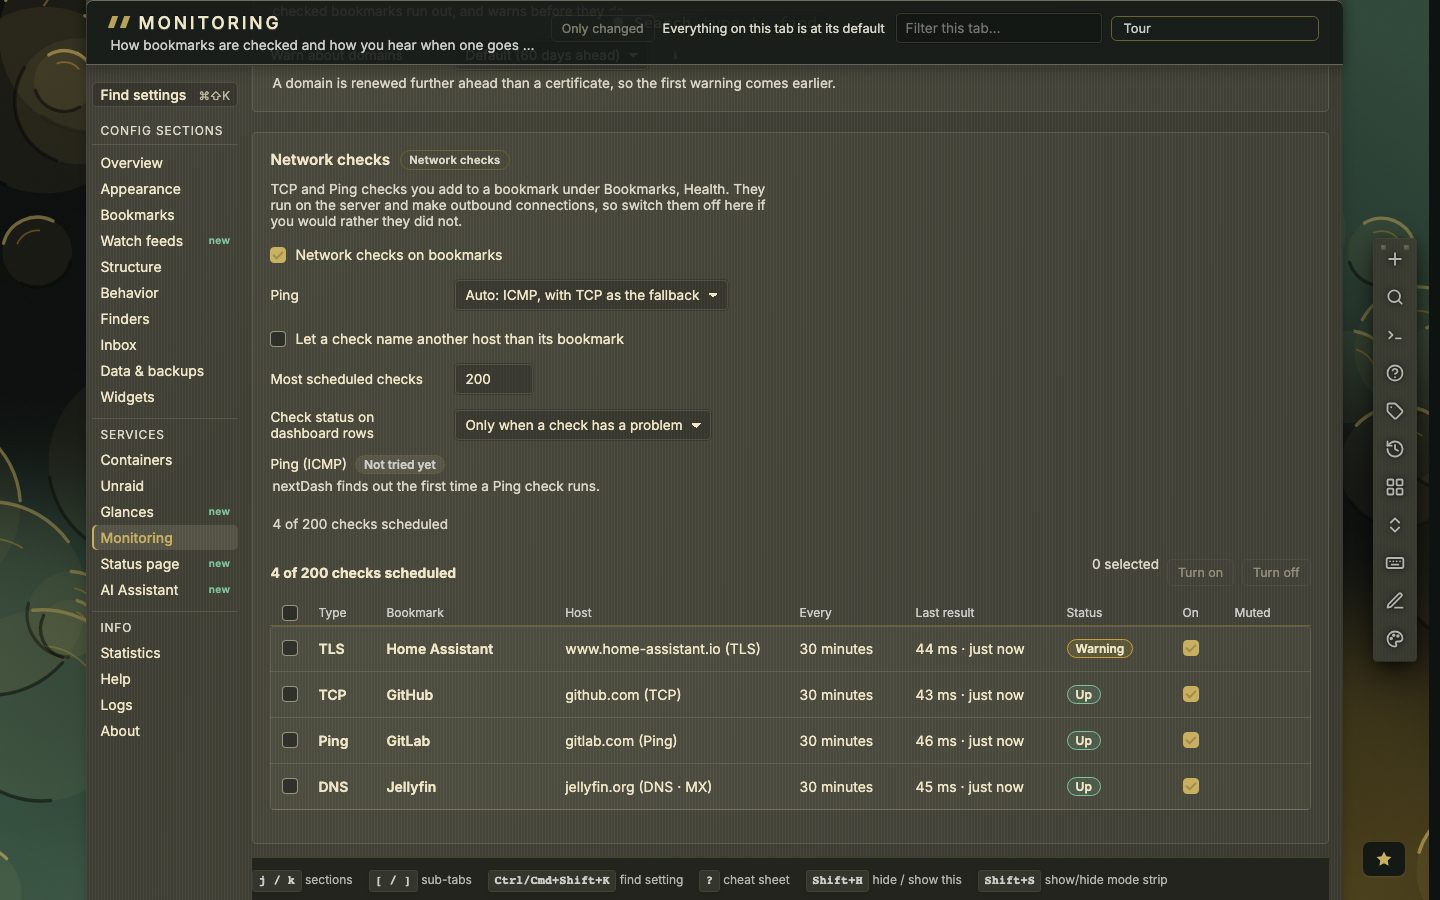
A check only tests its own bookmark’s host unless you allow otherwise. Ping needs ICMP; when the container cannot send it, the check falls back to TCP and shows via TCP. To allow a real ping, add this to the container:
sysctls:
  net.ipv4.ping_group_range: "0 2147483647"
A bigger weather in the header
In the classic header, the weather beside the clock now shows its icon and the temperature in large type, with the day and place in small lines beside them.

Smaller changes and fixes
- A new container’s notice is now a row in the bell, with Undo, Move and Done, instead of a card in the corner.
- The bell is hidden on a phone.
- The Bookmarks view’s side panel no longer shows black blocks on a see-through look.
Upgrading
Pull the new image:
docker pull ghcr.io/jordibrouwer/nextdash:latest
# or
docker pull foobar1452/nextdash:latest
On Unraid, update the container from the Docker tab. No settings change is needed. The full list is in the GitHub Release, and the network checks have their own chapter in the manual.