nextDash is a keyboard-first, self-hosted bookmark dashboard. No accounts, no cloud, no noise. You run it on a machine you own, you open it in your browser, and you drive the whole thing without ever reaching for the mouse. It is the start page your browser bar was always supposed to be, and never quite became.
This page is the long version. If you just want to try it, skip to the quickstart and be up in two minutes.
The problem
Everyone’s bookmarks end up the same way. A bar full of favicons with no labels. Folders nested three deep that you never open. A “read later” pile that is really a “read never” pile. And somewhere in there, a slow rot you can’t see: links that 404, domains that lapsed, articles that quietly moved, sites that now redirect to a parked page full of ads.
The hosted tools solve the organising part, but they ask for an account and a copy of your links on somebody else’s server. That trade never sat right for something as personal, and as boring, as a list of URLs. Your bookmarks are a map of what you care about. That map should live on your own disk.
What nextDash is
A single Go binary and a folder of data. That’s the whole thing. No external database, no account system, no telemetry running behind your back. Point it at a directory, open the port in your browser, and you have a dashboard with pages, categories, and tags — organised the way you think, not the way an app decided for you.
It is built for one person, or a small team, on a network you trust. It suits developers, sysadmins, homelabbers, and anyone who lives in a terminal and wishes their browser behaved the same way.
Your bookmarks. Your terminal. Your rules.
Quickstart
The fastest route is Docker Compose. Drop this in a docker-compose.yml and start it:
services:
  nextDash:
    image: ghcr.io/jordibrouwer/nextdash:latest
    container_name: nextDash
    ports:
      - "8080:8080"
    volumes:
      - ./data:/app/data
    restart: unless-stopped
docker compose up -dOpen http://localhost:8080 and you are looking at an empty dashboard. Import your browser’s bookmark export from the config screen, or start adding links with &. That’s it — you’re running.
Everything is a keystroke
This is the part that changes how the tool feels. Arrow keys move the selection through your bookmarks, Enter opens the focused one, and the digits 1–9 jump straight to a page. You never have to aim at anything.
| Key | What it does |
|---|---|
/ | Fuzzy search across names, URLs, tags, and notes |
> | Open search, with recent and saved queries as chips |
: | Command palette — everything the app can do, by name |
@ | Search every page at once |
? | Finders — fire a query at Google or any engine you define |
+ / & | New bookmark, or a one-line quick-add |
Shift+I | Open the Inbox |
Shift+H | Open the Health view |
! | The cheat sheet, in case you forget any of this |
Prefer the mouse for some things? That still works. Right-click a bookmark for every action in one menu, drag the strip on its edge to move it between categories, long-press a row to edit it in place. The keyboard is the fast path, not the only path.
Search, commands, and finders
Press > and a panel opens over the dashboard: your recent searches, saved as one-click chips so you never retype the same query twice; a running list of recent commands; the full command list, grouped so you can scan it instead of guessing; and your saved filters, ready to reapply. Nothing here needs the mouse — type, arrow down, Enter.
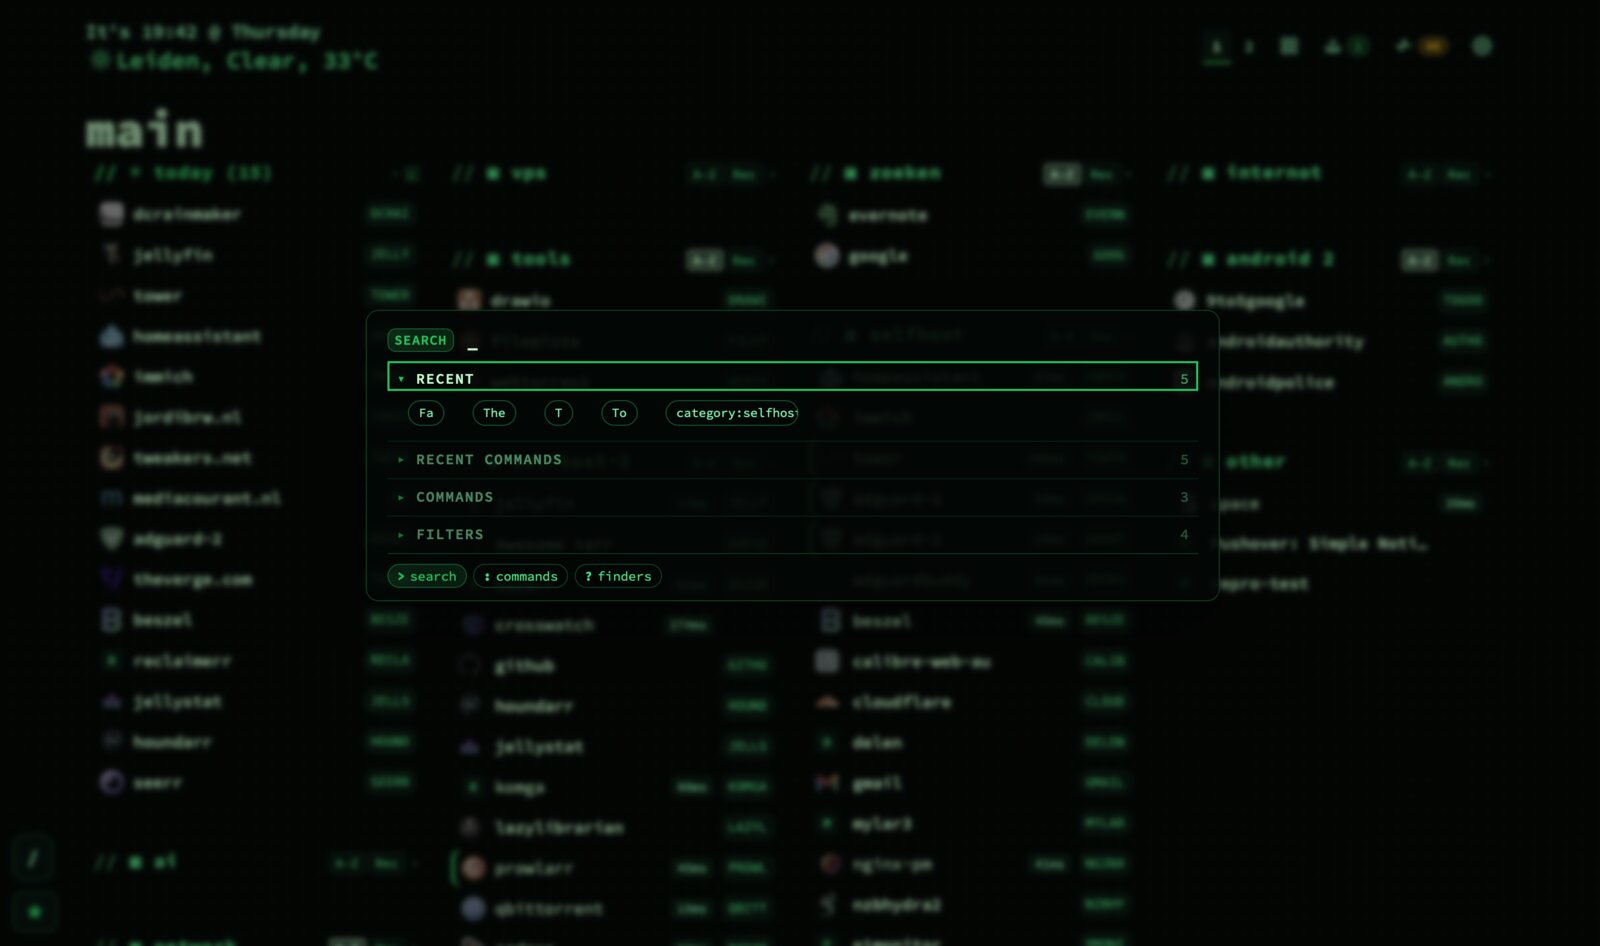
: is the command palette: type a few letters of anything the app can do — switch pages, open a config tab, toggle a setting — and it shows up by name, no menu-hunting required. @ widens whatever you searched for to every page at once, not just the one you’re looking at. And ? opens Finders: define your own set of search engines (Google, a self-hosted SearxNG instance, your wiki, whatever you actually use) and fire a query at one of them without leaving the dashboard.
The features that earn their keep
A health view that shows you the rot
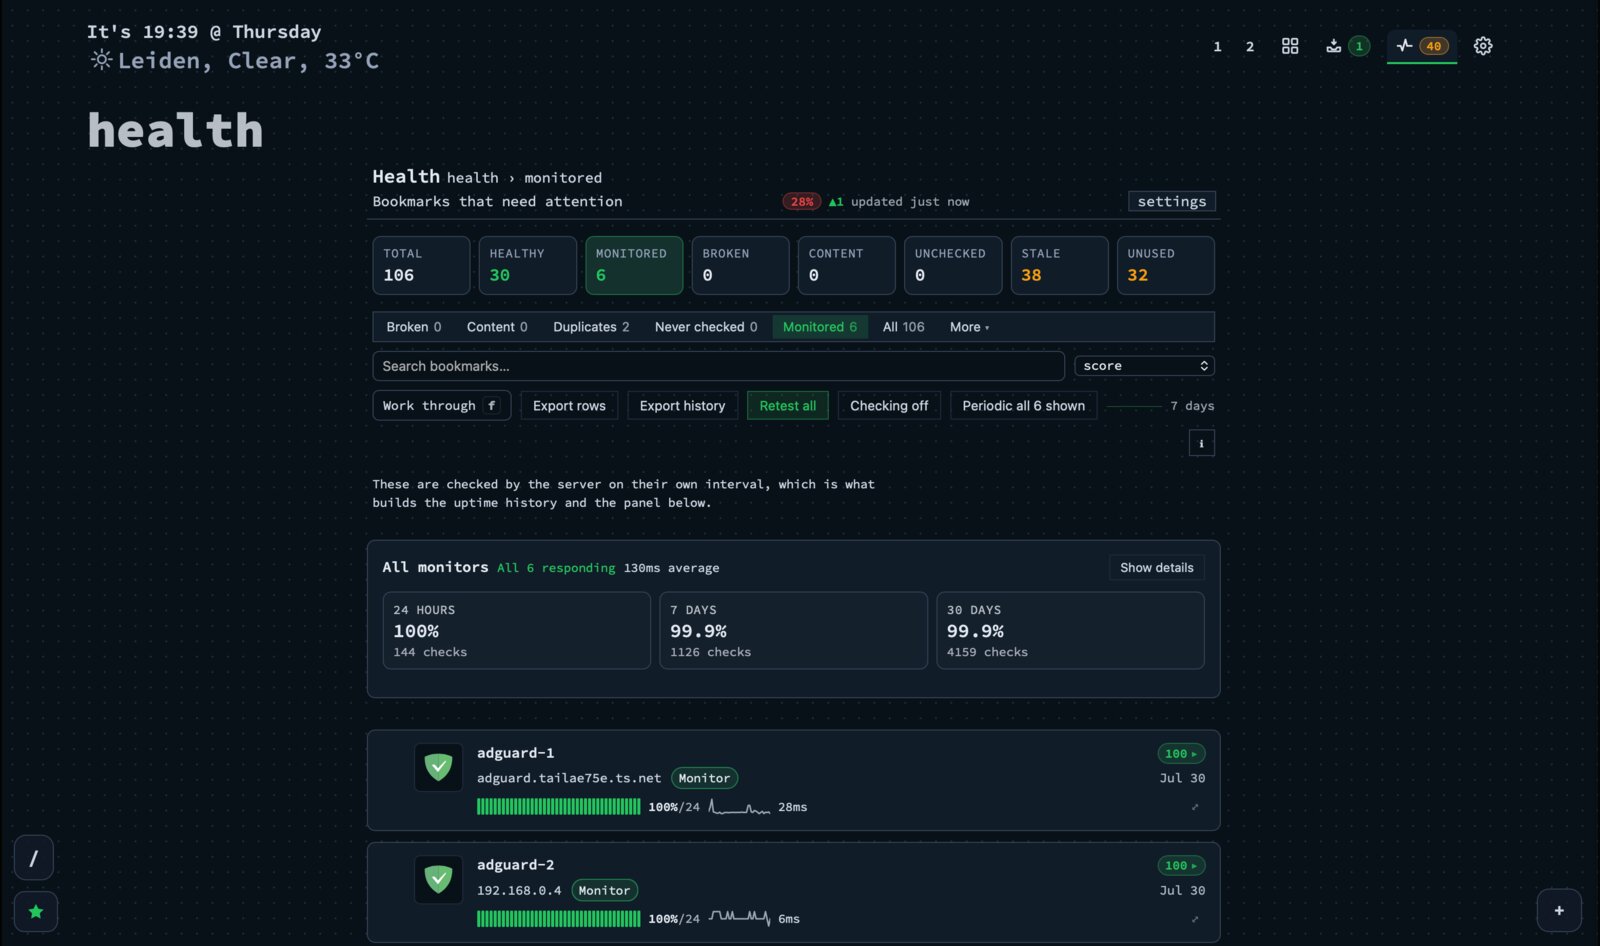
Bookmark collections decay silently. The Health view turns that into a short worklist, split into Broken, Content issues, Duplicates, Never checked, Stale, and Unused, next to a running total and how many are Healthy. And next to every row, one detail that decides most of the work for you — when you last opened it. A dead link you haven’t touched in two years isn’t worth fixing. A dead link you opened yesterday is. The list tells you which is which.
You’re not stuck clicking rows one at a time either. Search narrows the list, “Work through” steps you through it one bookmark at a time instead of dumping everything on you at once, and “Export rows” or “Export history” hand you the raw data if you’d rather work in a spreadsheet. “Retest all” re-checks everything on demand, on top of whatever schedule is already running in the background.
Uptime monitoring for the links that matter
Every bookmark gets one of three checking modes, set individually — in its own editor, or with a right-click on the dashboard:
| Mode | What it does |
|---|---|
| Off | No availability checking at all. |
| Periodic | Checks once a day and flags the bookmark the moment it breaks. |
| Monitor | Checks on your own interval and keeps a full uptime history — a heartbeat, response times, and outage alerts — on top of everything Periodic does. |
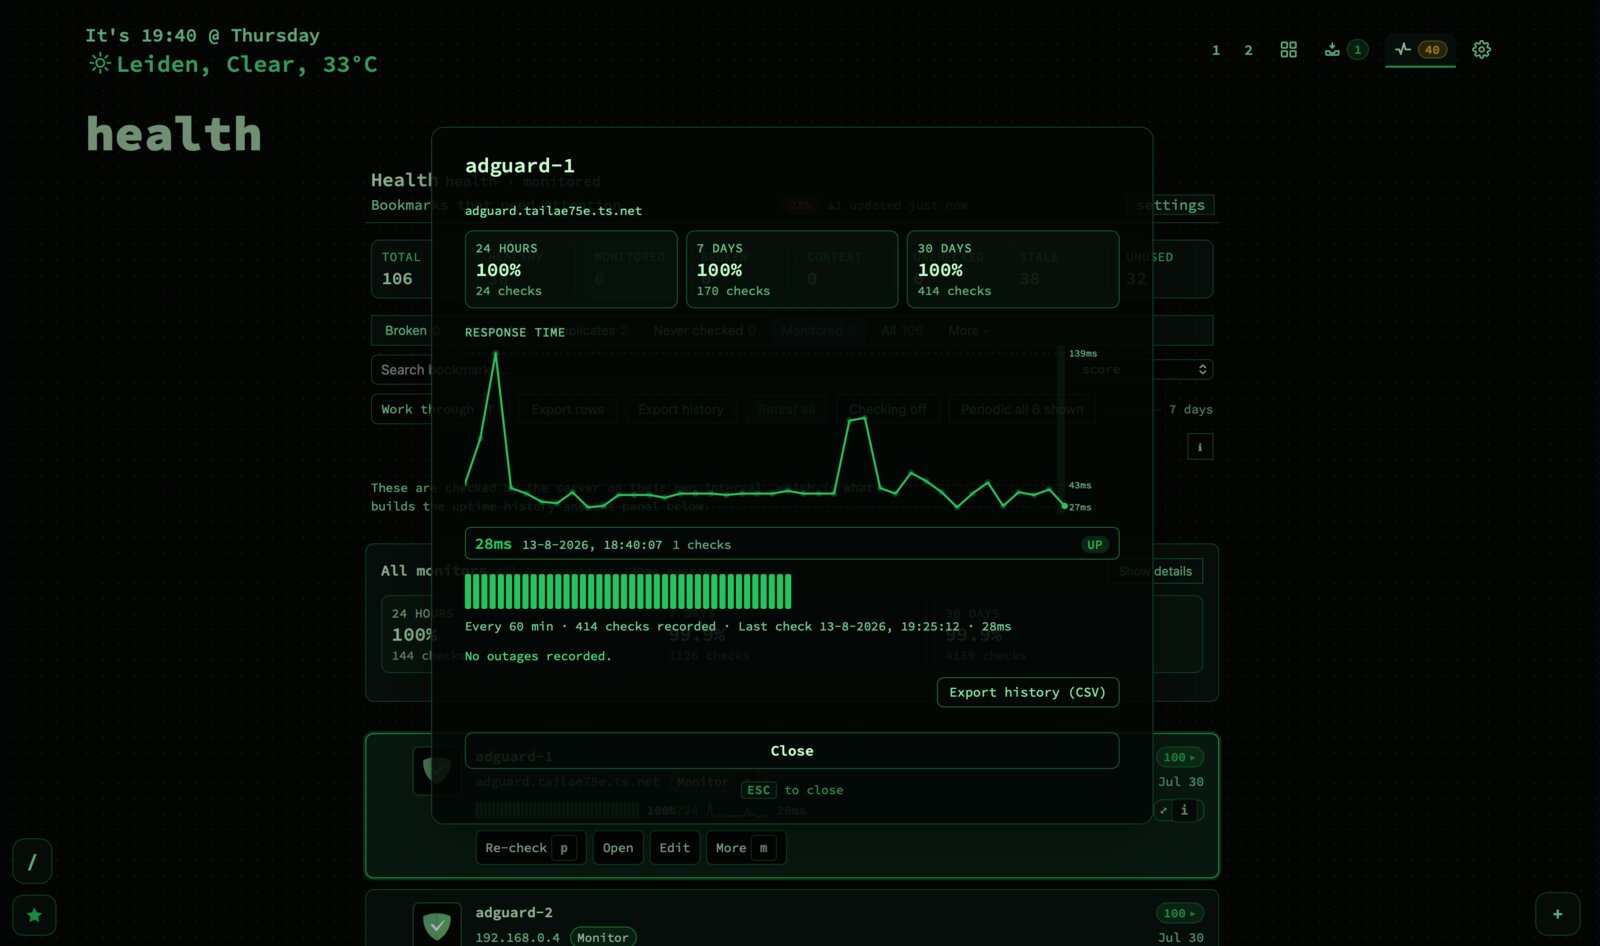
Flag something as monitored and it earns its own detail view: an uptime percentage over 24 hours, 7 days, and 30 days, a response-time chart, a heartbeat bar of every check that’s run, and a CSV export if you want the raw numbers. When something goes down, a webhook fires, or a browser notification reaches you while nextDash itself is closed. Your self-hosted services just got a status page you didn’t have to build.
An inbox for links you can’t deal with yet
Filing a link properly takes a decision, and you don’t always have one ready. Paste a URL — or save it from the Chrome extension, or capture it with a tag already attached — and drop it straight into the Inbox: no page, no category, required up front. Later, open the Inbox and triage the pile at your own pace: snooze it, mark it read, or promote it into a real home.
Tags on inbox items are filter chips you can search, edit straight from the row, and that follow the link into both export formats. Selecting more than one is quick — shift-click or shift-arrow for a range, Ctrl/Cmd+A for everything — and from there you can bulk-promote, bulk-open, or bulk-copy the links in one go. A small stats panel sits right there too, so you can see how big the pile actually is without switching to config. It’s the difference between a system you maintain and a system that maintains a pile of guilt.
Collections that build themselves
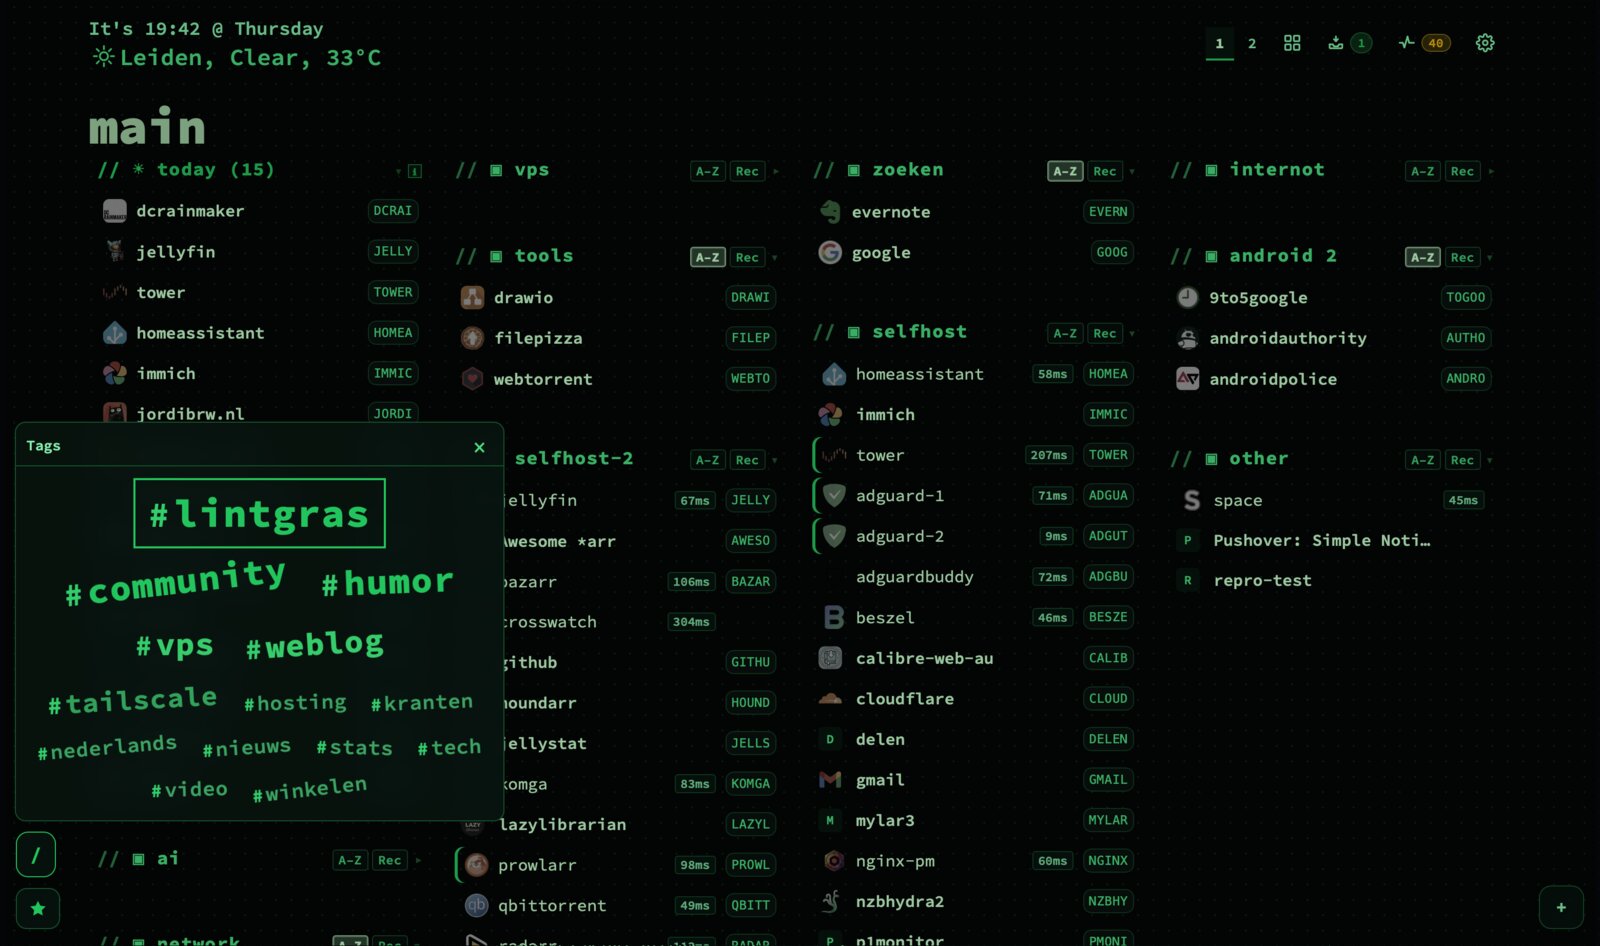
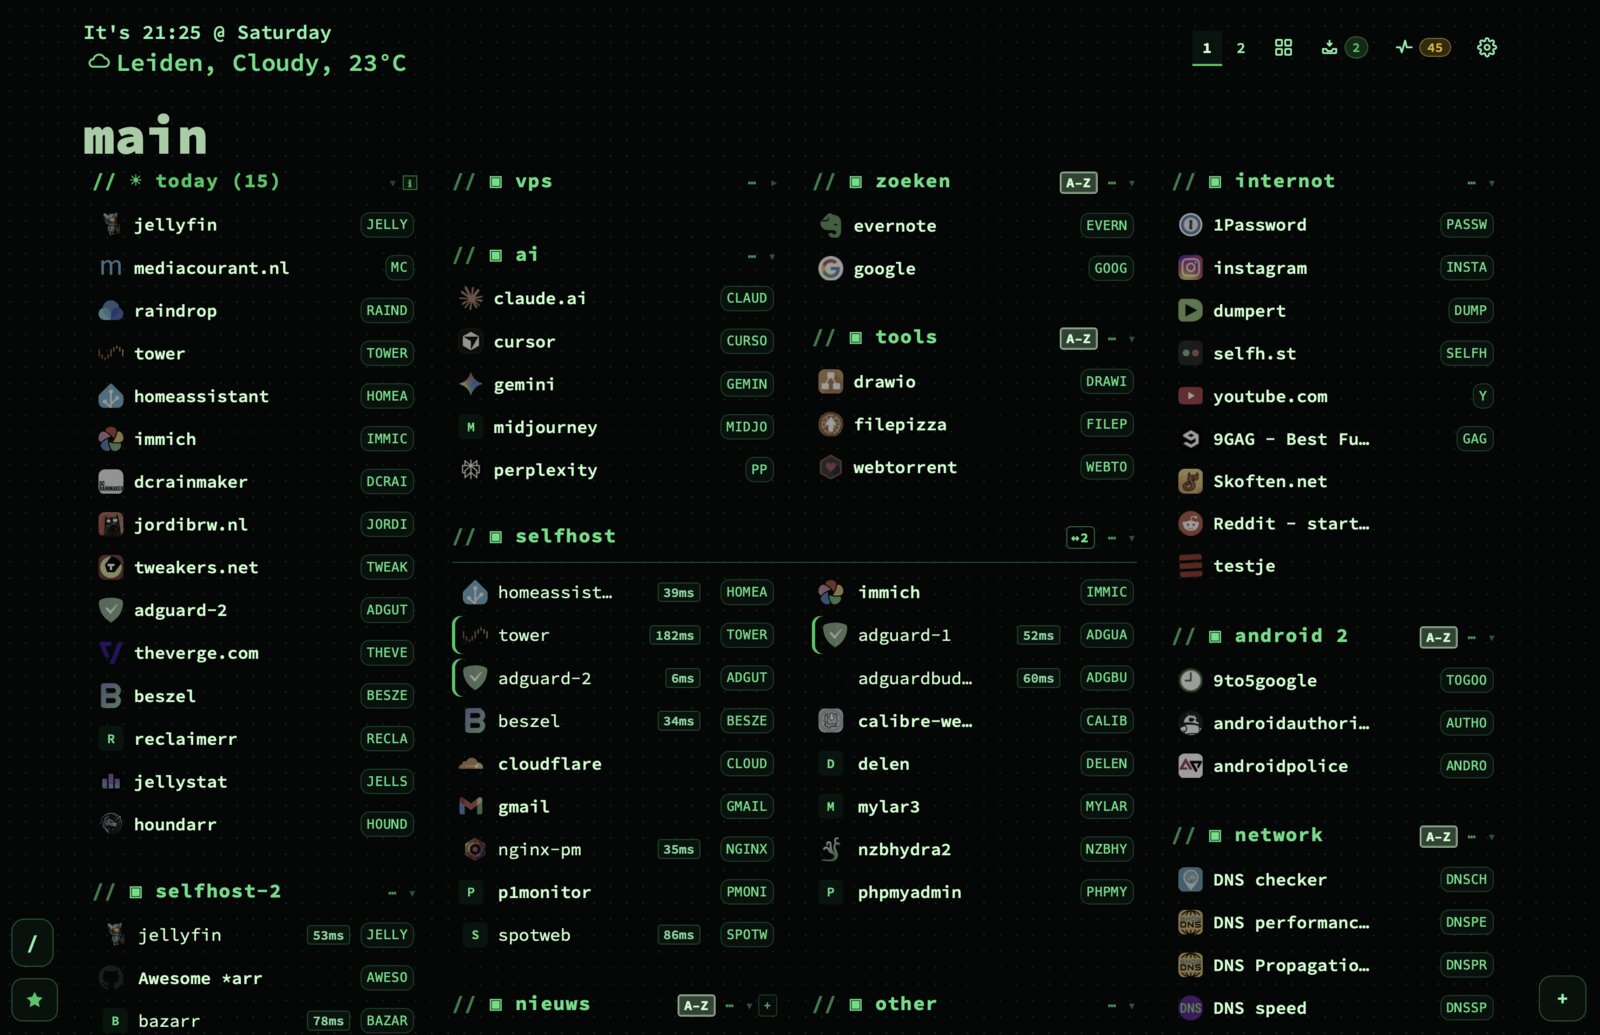
On top of what you file by hand, nextDash surfaces groups on its own: Today, matched against your own keyword sets; Recently opened; Most used; Stale, the links you’ve quietly stopped visiting; and one group per tag once it has enough entries. Tags themselves open as a word cloud sized by how often you actually use them, so digging into “everything tagged #selfhost” is one click, not a search query you have to remember. The dashboard reorganises itself around how you actually work.
Know your habits
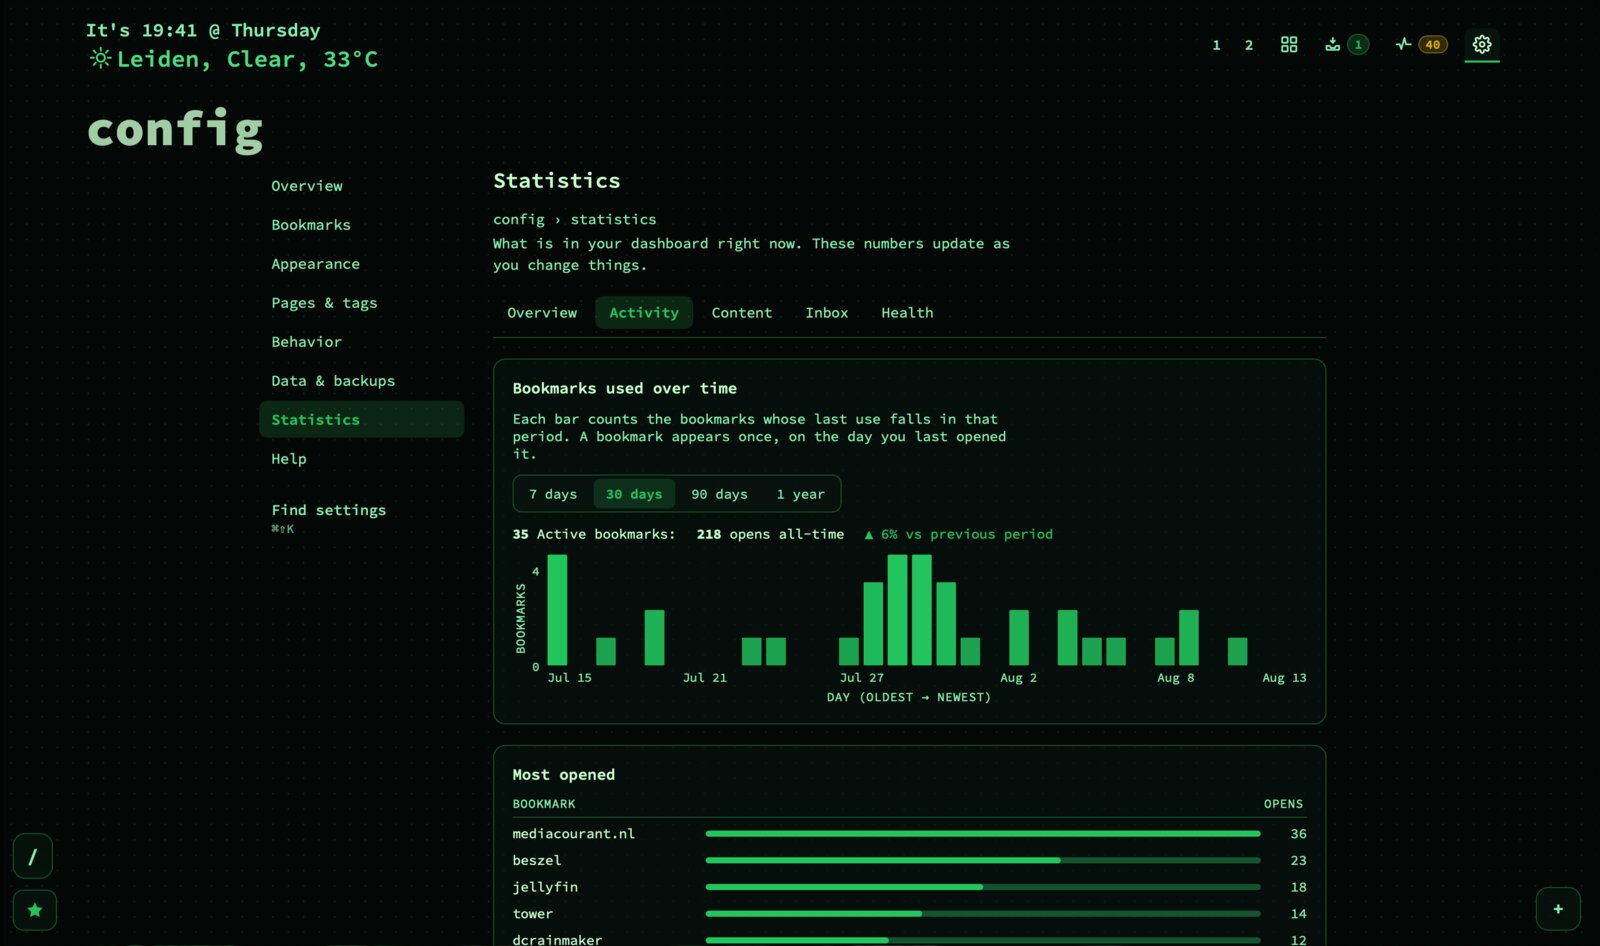
Config → Statistics keeps a quiet record of how the dashboard actually gets used: a bar chart of active bookmarks over the last 7, 30, 90 days or year, a week-over-week trend so you can see whether that number is climbing, and a ranked “most opened” list — so instead of guessing which fifteen links you actually rely on, you can just look it up.
Make it look like yours
Fifty-plus built-in themes with a custom theme editor, seven layout presets from a tight list to large launcher tiles, adjustable columns, density, and fonts. It’s not a coat of paint over the same three screens either — switch themes and the dashboard, health view, statistics, and every config tab repaint themselves entirely. Full ZIP backup and restore, CSV export, a Chrome extension for saving the current tab, and a UI translated into English, Dutch, German, and French round out the rest.
Settings that don’t overwhelm you
Config → Overview is a snapshot, not a wall of toggles: a “needs attention” panel calls out anything that actually wants you — monitors down, unread inbox items, duplicate bookmarks — each with a button straight to the relevant view. Below it, an at-a-glance summary: a cleanup score, how many bookmarks, pages, categories and tags you have, what share of bookmarks are tagged, how many are monitored, and a running “X settings differ from the default” count so you always know how far you’ve strayed from a stock install.
Every settings tab has the same “only changed” filter, so a long options page collapses down to just the handful of things you’ve actually touched. And a browsable “what’s new” panel — paginated, dozens of releases deep — means you can always see what changed and when, without leaving the dashboard to go read a changelog on GitHub.
A note on trust
nextDash has no login by design. It assumes a network you trust — so keep it behind Tailscale, a reverse proxy with authentication, or on localhost, and don’t hang it on the public internet. There’s an optional write token for the moments it has to live on a LAN. And the analytics? Off by default, opt-in only, and when they’re off the tracker isn’t even loaded onto the page. Self-hosting should mean the machine works for you, not the other way around.
Standing on shoulders
nextDash began as a fork of ThinkDashboard by MatiasDesuu, and has grown a fair way from there. It’s open source under the MIT license, which means you can run it, read it, change it, and ship your changes. Issues and pull requests are welcome — bugs, features, and translations alike.
The source, the full manual, the changelog, and a one-page keyboard cheat sheet all live in the repository. The git clone button below will take you there.
Now go host something.